Australia’s capital cities

Australia’s capital cities: Growth, change and a future forecast
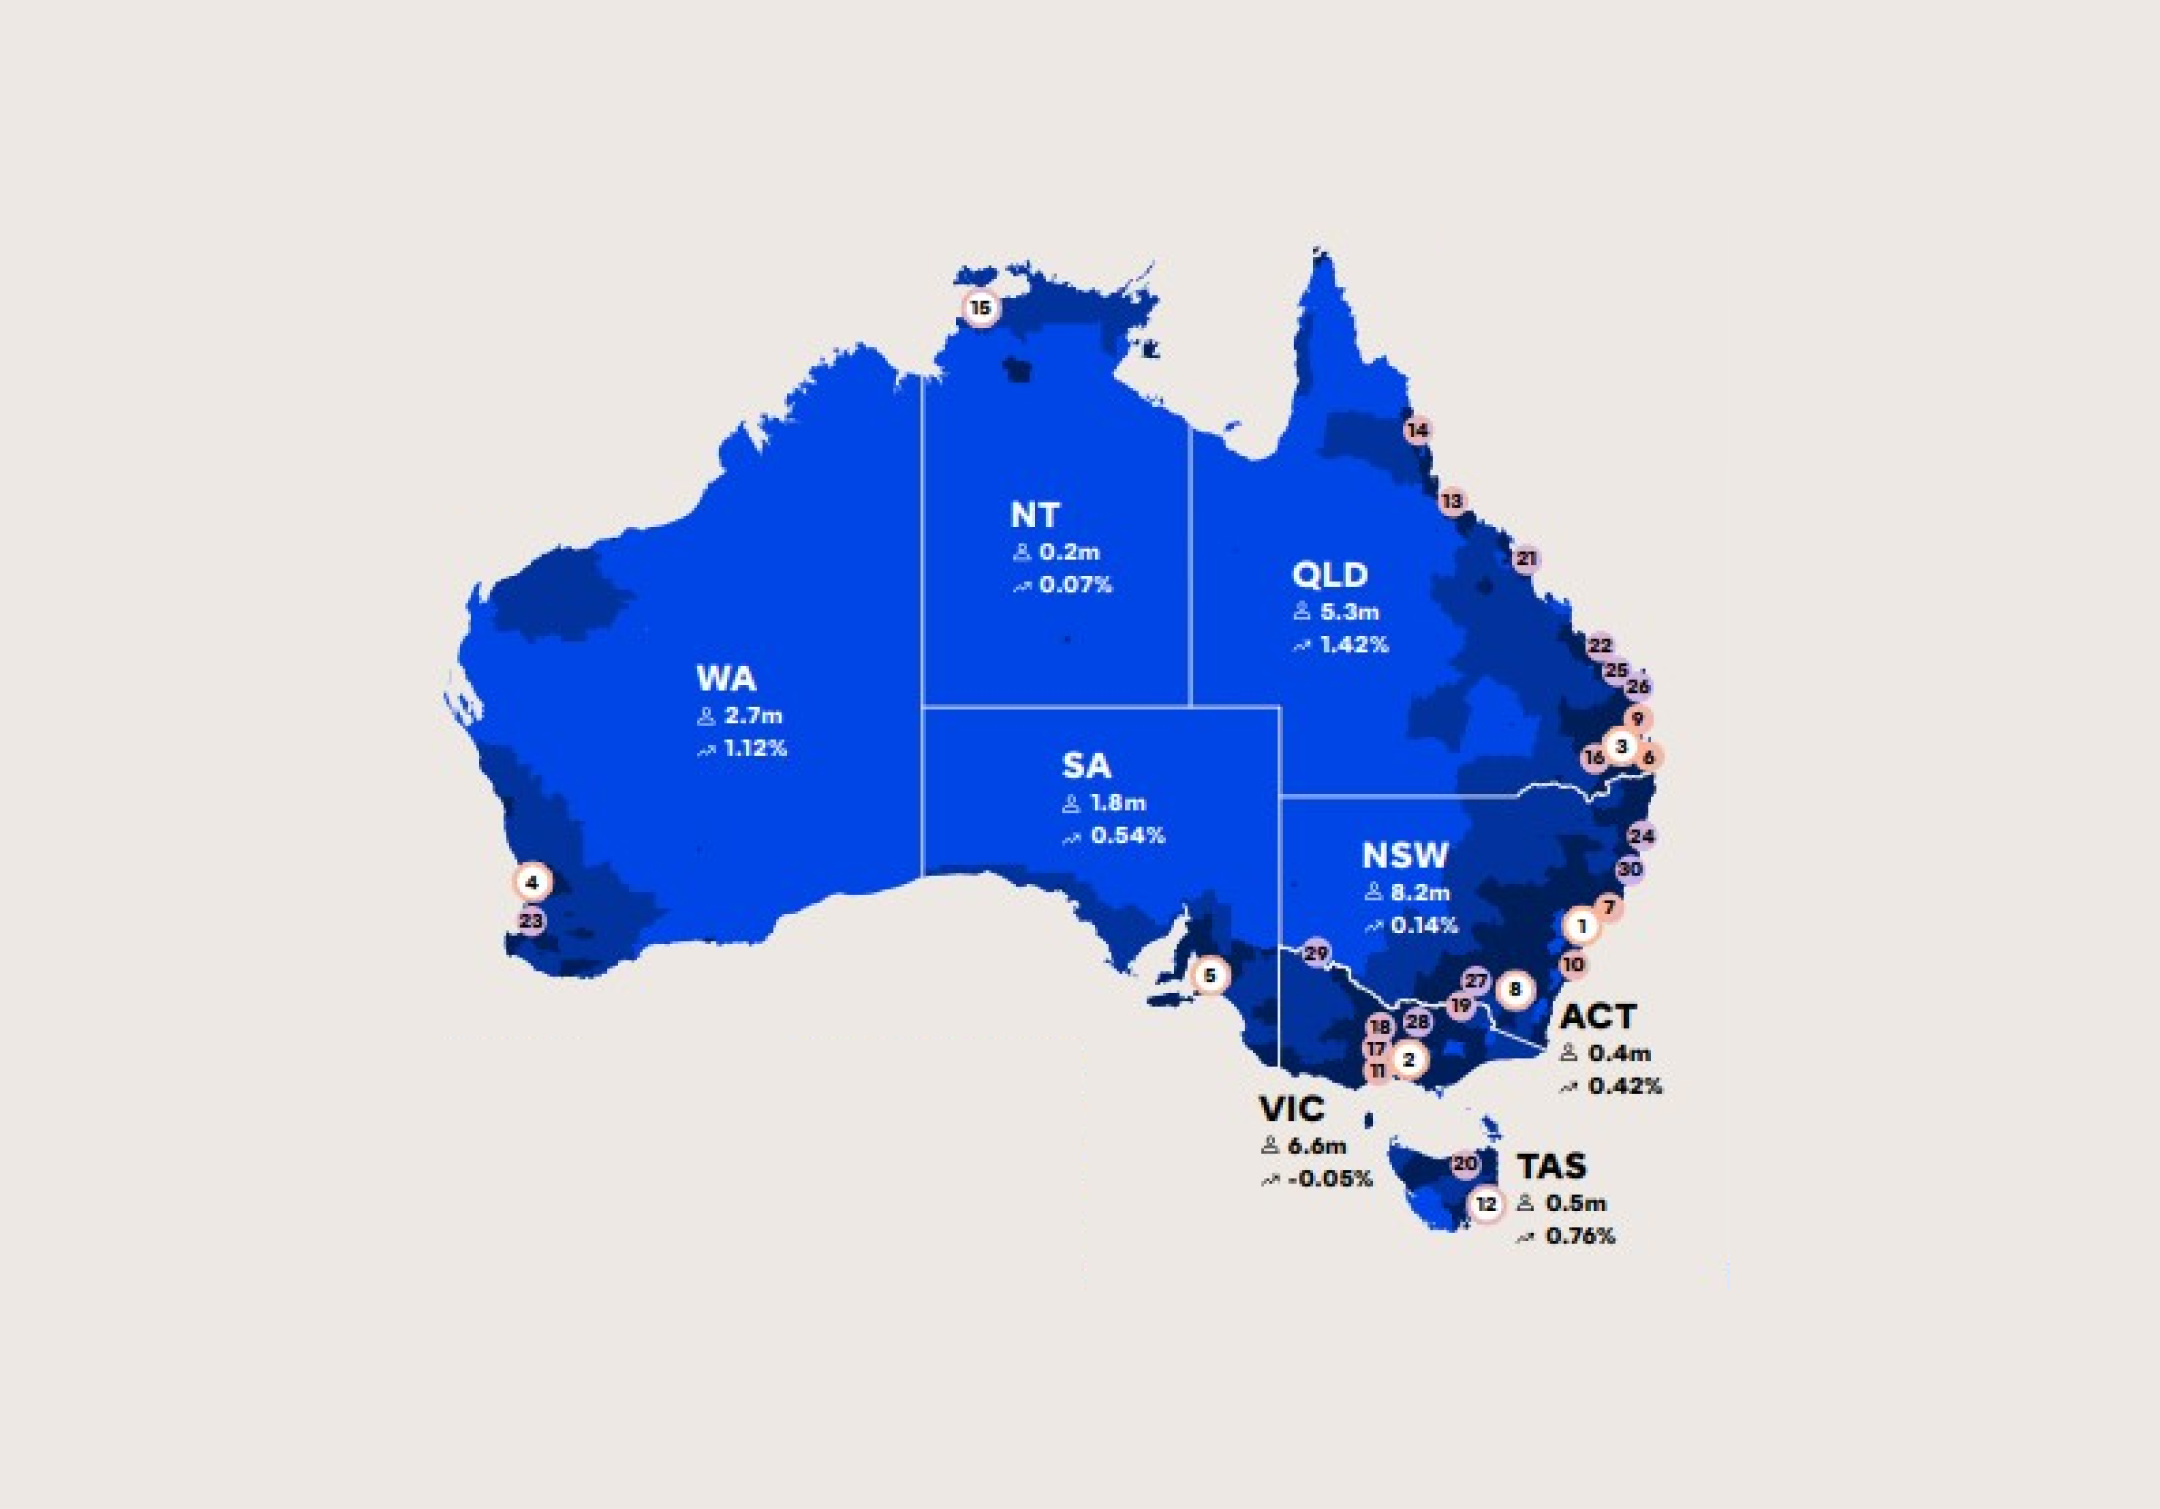
Over 66% of Australians live in the greater metropolitan area of Australia’s 8 capital cities with Sydney being the largest (around 4.9 million), followed by Melbourne (4.5 million). Darwin is Australia’s smallest capital city, with a current population of around 144,000. The nation’s capital, Canberra, has a population of 394,000, larger than Darwin and Hobart combined.
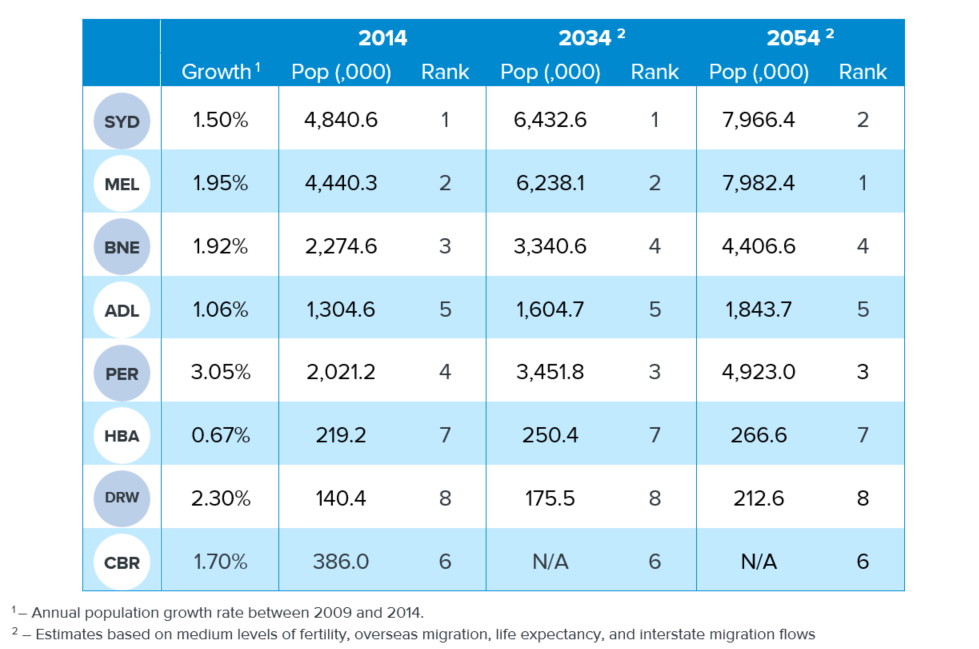
The title of fastest growing city is held by Perth which has recorded 3.05% per year for the past 5 years whilst Hobart has the lowest rate of growth of only 0.67% per year over the same period. Sydney and Melbourne recorded growth of 1.5% and 1.95% per year over respectively.
In terms of population increase, Melbourne comes up on top with an increase of 95,655 people in the last year while Hobart only had an increase of 1,247 people in the same period. In fact Melbourne is growing by more people every 5 days than Hobart adds in an entire year. Sydney recorded an increase of 84,230 people in the last year and based on this increase will be Australia’s first city to reach 5 million, a milestone it will achieve by the middle of 2016.
However, at a state level there have been significant changes over the last 3 years in the population growth rate across Australia. Western Australia, which was the fastest growing state has seen this annual growth rate more than halve from a peak of 3.68% in 2012 to just 1.58% currently. Over the same period of time, Queensland’s growth has also declined significantly from 2.0% to 1.37% now, while Victoria’s consistent population growth rate of 1.75% makes it the fastest growing of any Australian state or territory.
Sydney has a population approximately 400,000 larger than Melbourne’s but Melbourne is growing by over 10,000 more people than Sydney year on year. Assuming medium levels of fertility, overseas migration, life expectancy, and interstate migration flows, Melbourne will take Sydney’s title of Australia’s largest city in 2053 with both cities expected to reach a population of 8 million in 2055.
Perth’s rate of growth will see it overtake Brisbane in 2029 when they both have a population of just over 3 million. They currently have a population of 2.1 million and 2.3 million respectively.
Other significant urban areas
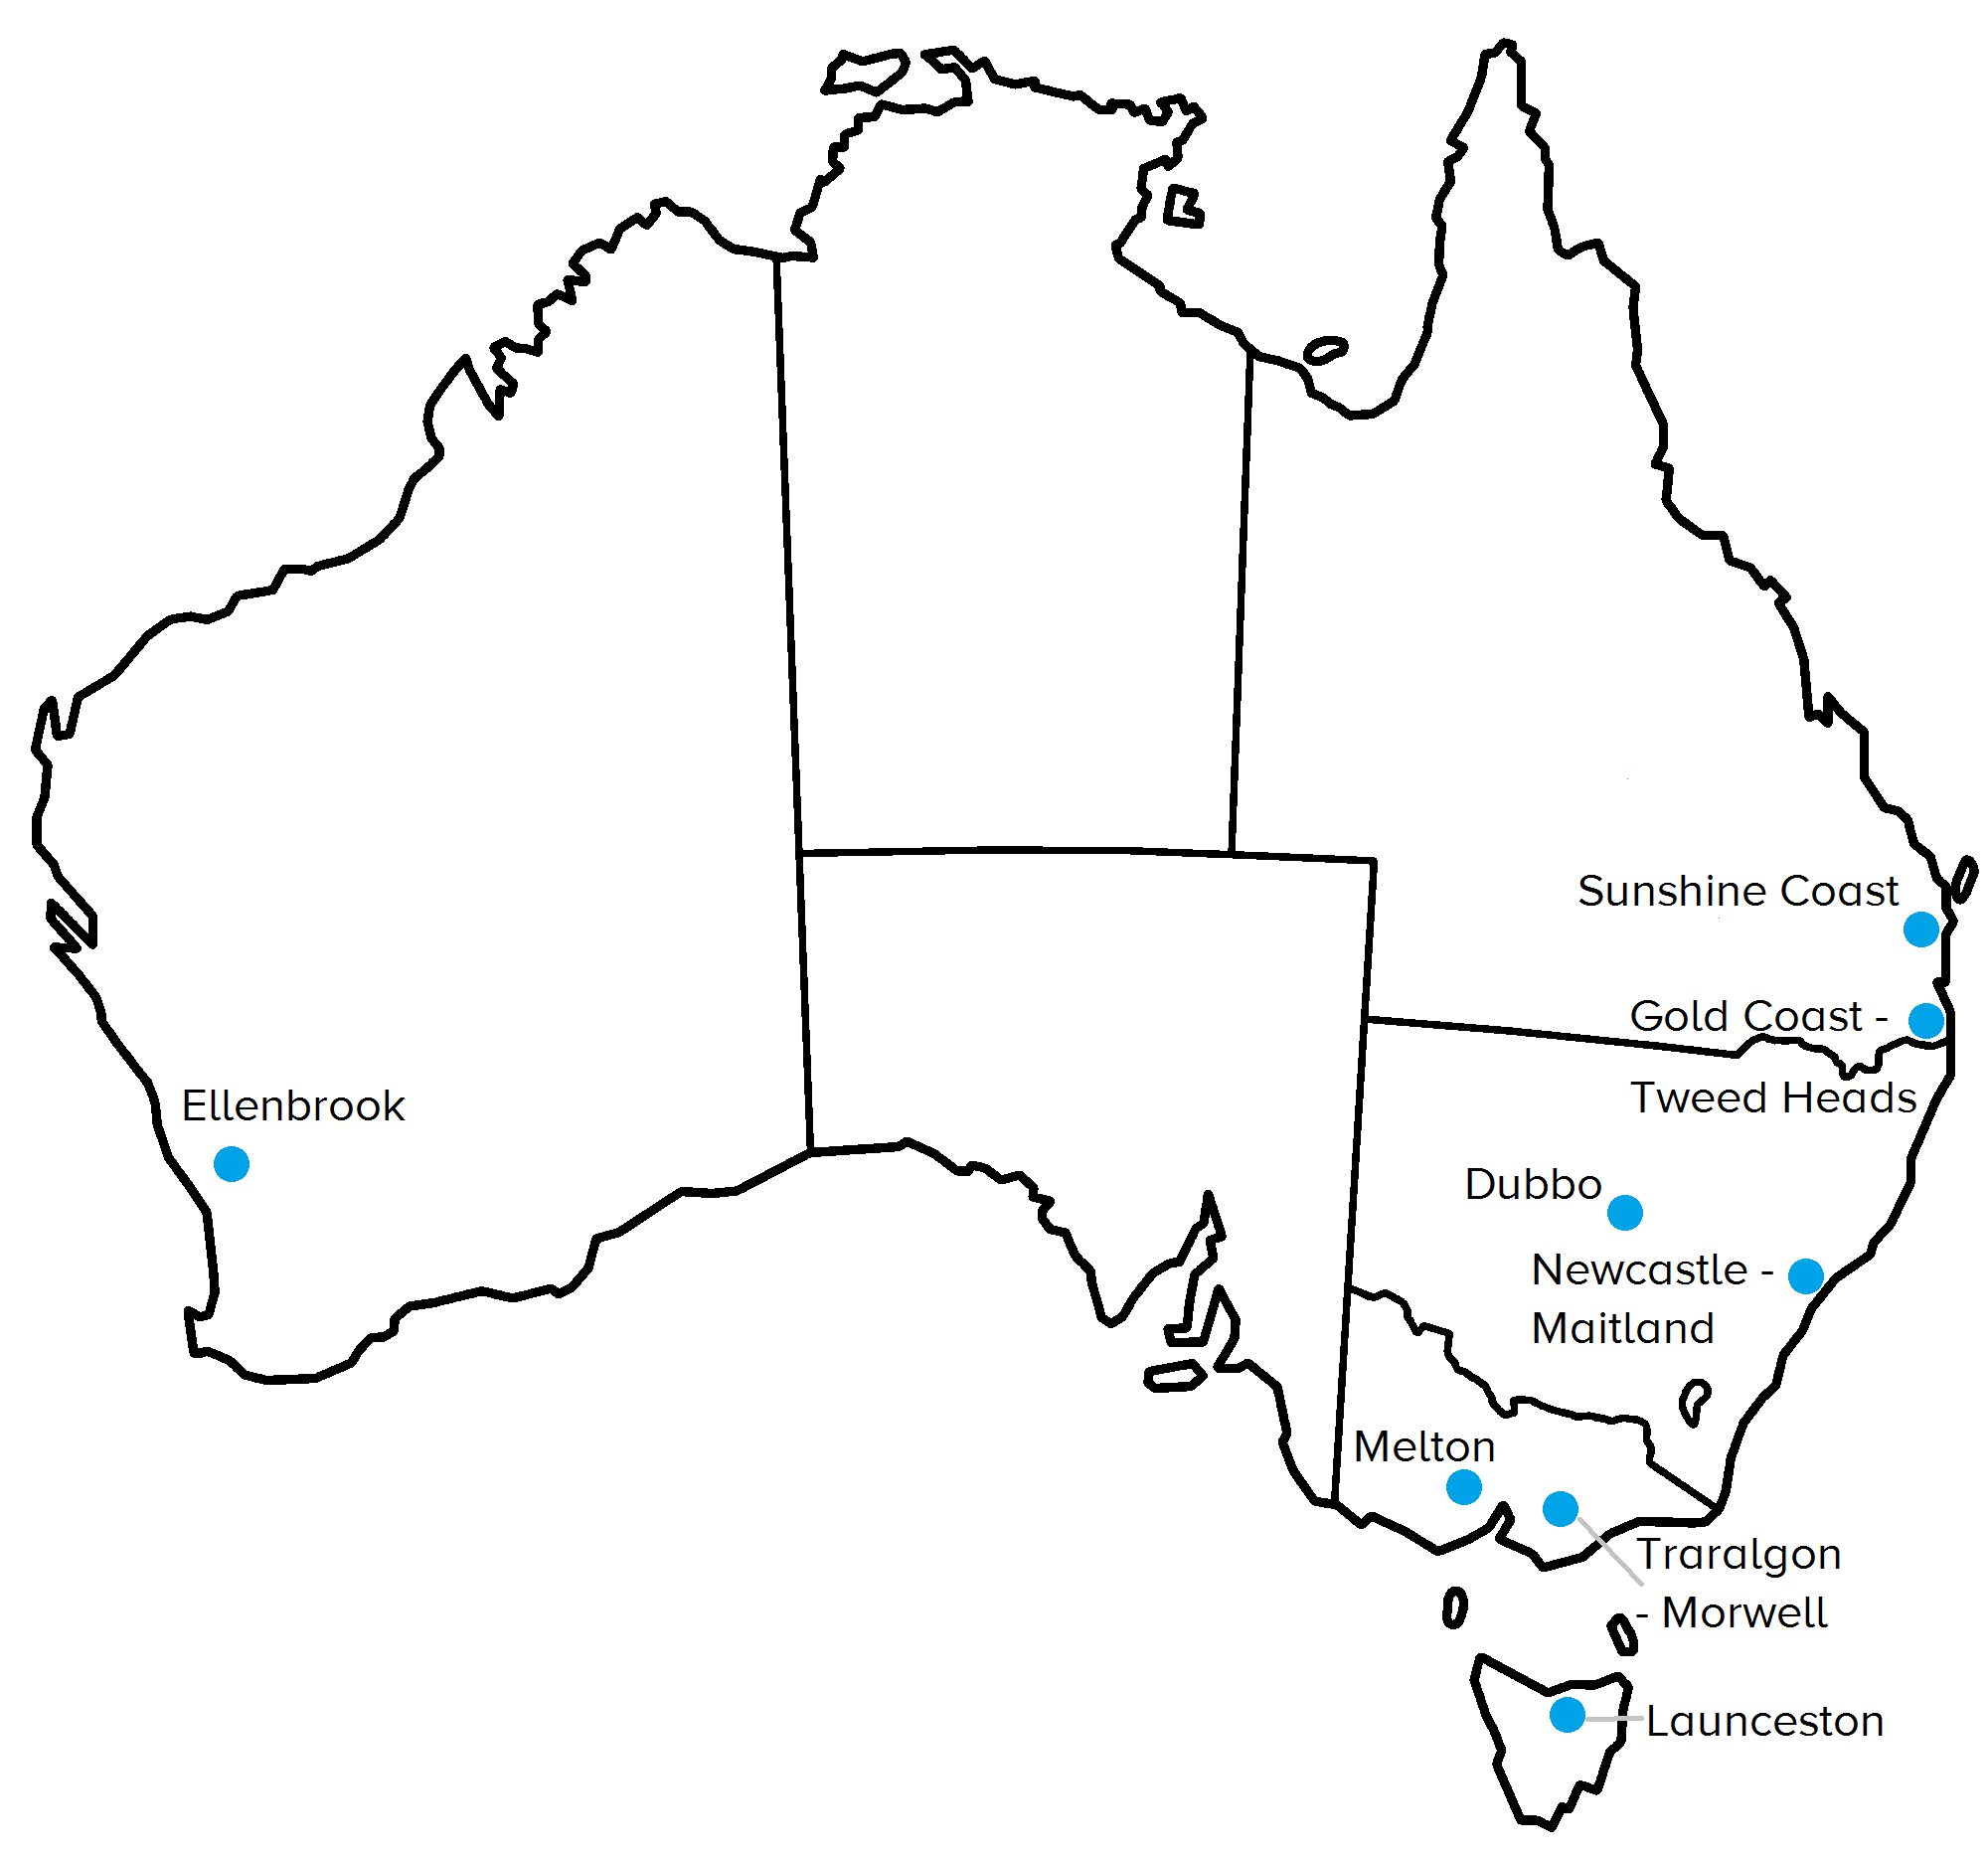
The Gold Coast – Tweed Heads area has the largest population outside of the capital cities (almost 630,000) and also registered the largest increase in number of residents in 2009 to 2014. The 2nd largest urban area is the Newcastle – Maitland area but the Sunshine Coast had the 2nd largest increase in population even though they are ranked 4th in terms of population size. The City of Dubbo, with a population of 36,622 is the smallest of Australia’s significant urban areas.
Launceston recorded the lowest smallest rate of population increase between 2009 and 2014, growing by only 0.35% per year but they are ranked 13th in overall population, out of 32 significant urban areas. The Traralgon – Morwell area was the only area to experience a population decline with a decrease in population of 28 between 2013 and 2014.
On the other end of the scale, Ellenbrook is the fastest growing urban area by far, recorded growth of 8.35% per year between 2009 and 2014 followed by Melton which recorded growth of 5.32% per year over the same period.
Australia’s capitals: Population projections
Sydney
- Reach 5m in 2016, 6m in 2029, 7m in 2042, 8m in 2055
- Average annual growth from 2016-2056 = 1.23%
Melbourne
- Reach 5m in 2021, 6m in 2032, 7m in 2043, 8m in 2055
- Average annual growth from 2016-2056 = 1.44%
Brisbane
- Reach 3m in 2028, 4m in 2047
- Average annual growth from 2016-2056 = 1.6%
Adelaide
- Reach 1.5m in 2027
- Average annual growth from 2016-2056 = 0.83%
Perth
- Reach 3m in 2028, 4m in 2042, 5m in 2055
- Average annual growth from 2016-2056 = 2.14%
Hobart
- Reach 250,000 in 2034
- Average annual growth from 2016-2056 = 0.47%
Darwin
- Reach 200,000 in 2048
- Average annual growth from 2016-2056 = 1.08%
Sydney vs Melbourne
- Melbourne will overtake Sydney for the title of largest Australian city in 2053
Brisbane vs Perth
- Perth will overtake Brisbane for the title of 3rd largest Australian city in 2029
*Data assuming medium levels of fertility, overseas migration, life expectancy, and interstate migration flows.
Sources: ABS, McCrindle
Find Out More