Cost of Living: Still the Number One Issue


With the federal budget on release tomorrow evening, a new McCrindle Research survey reveals that cost of living is still the front of mind issue for Australians. In early 2013, Gen Ys, Gen Xers, and the Baby Boomers across the nation expressed that the rising cost of living was their number one concern (see previous study here), which has held true in our latest research…
Click here to download the PDF.
Overall perceptions from state to state
Interestingly, two thirds of Australians think that the cost of living in their state is much higher or somewhat higher than all the other states and territories. The belief that life is most expensive in one’s own state is highest in Western Australia, where 91% of respondents said their living costs are greater than those in other states and territories (compared to the national average of 69%). Next in line is New South Wales, with 82% of respondents noting the cost of living to be higher in their state than in other states and territories, followed closely by ACT and Tasmania, both at 80%. Queenslanders and South Australians feel they have the best affordability with less than half (46%) saying living costs in their state are higher than elsewhere around the country.
The pressure is on
88% of Australians feel the cost of living pressures are greater today than 5 years ago. While Western Australia had the same percentage as the national average when analysing the increase overall, in the extreme increase category it had the highest response at 63% (compared to the national average of 47%). The strongest response overall was given by South Australians, with 95% feeling an increase in cost of living pressures.
Cost increases just keep going up
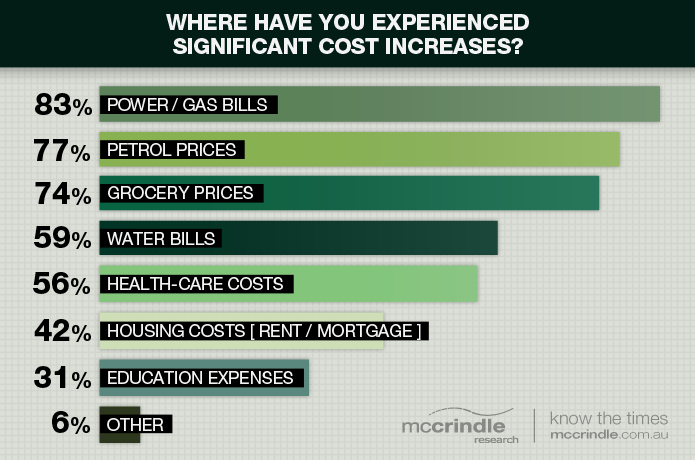
Cost increases have been most felt through utility bills, with 83% of Australians reporting that they have experienced cost increases in their power and gas bills that have had a significant impact on their cost of living. Petrol prices are the next in line, with 77% reporting significant costs, followed by grocery prices – reported to have increased significantly by 74% of the population.
More Tasmanians than other Australians (93%, compared to the national average of 83%) report paying power and gas bills that have increased significantly in price in the last 5 years. In a similar way, respondents from the ACT report high cost increases in the cost of housing over the last 5 years when compared to the other states (78% report that they’ve experienced cost increases that have had a significant impact on their cost of living, compared to the national average of 43%).
The blame game
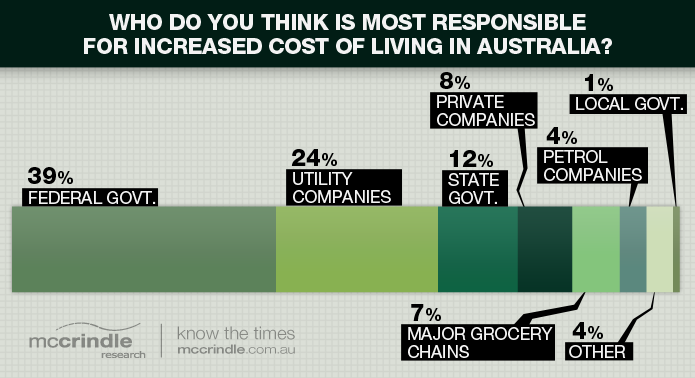
39% of Australians assert that the Federal government is most responsible for increased living costs, with only 1% of the blame directed towards local constituent government bodies. While only 34 % of Generation Ys primarily blame the government for the rise of living costs, that percentage rises to 37% for Gen Xers, 42% for Baby Boomers, and 49% for Builders – blame on the federal government therefore increases with age.
Utility companies are the next in line, with almost a quarter of Australians reporting that water, electricity, and gas companies are to blame. In Tasmania, sentiment towards utility companies is worst – with 40% of Tasmanians reporting that utility companies are to blame (compared to the national average of 24%). Tasmanians also appear to have the best perceptions towards the federal government, with only 13% of them directly placing blame on the federal government.
Everyday shopping changes
Over half of Australians report making significant changes to their shopping patterns over the last 5 years:
-
- 59% have changed how much they buy by cutting back on some purchases and not eating as much.
-
- 52% of respondents have changed what they buy, buying more private label or supermarket products rather than recognised brands.
-
- 51% of respondents have changed where they buy, shopping in cheaper supermarkets and bulk retailers
- 48% have changed how they buy through online shopping, using discount vouchers, and only buying items on sale
Reducing lifestyle expenditures
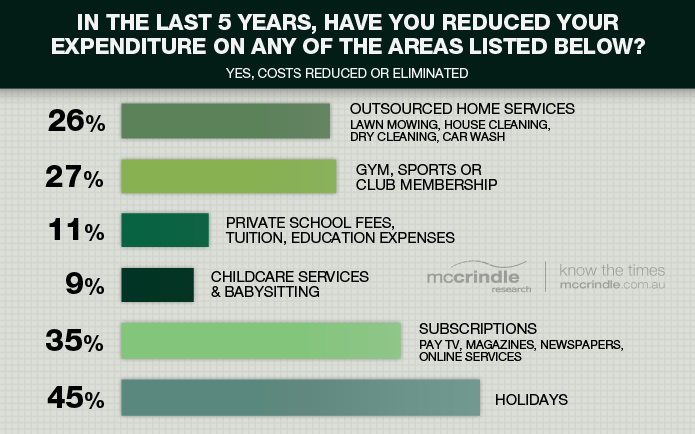
Over the past five years, Australians have significantly reduced their expenditure on a number of different products and services. Holidays have been the first to go, with 45% of Australians having reduced their costs or eliminated expenditure on holidays altogether. Over one third of Australians have changed their expenditure to subscriptions such as TV, magazines, newspapers, and online services. Over a quarter of Australians have reduced their gym, sports, or club memberships, and reduced the outsourcing of home services.
While the study shows that Australians will readily give up their holidays or paid subscriptions when times get tough, they are less willing or able to cut back when it comes to their children: Only 11% of Australians report making cut-backs on private school fees, tuition, and education expenses, and only 9% have reduced spending on childcare and babysitting services.
Grim economic outlook
There is a fair bit of pessimism among Australians today – 3 out of 4 individuals feel that we are ‘worse now’ economically than we were last year. Out of this group of respondents, 65% hold that Australia will be even worse next year, whereas the rest believe there will be a positive turn-around. Western Australia is the most optimistic state when it comes to economic outlook, with 28% of respondents sensing that Australia is economically better now than last year and will be even better next year (compared to only 13% of the national average who held that same view).
Opinion on the grimness of Australia’s economic outlook increases with age. While only 29% of Generation Ys hold to the matter that Australia is economically worse now than last year and will be even worse next year, 48% of Generation Xers, 57% of Baby Boomers, and 59% of Builders expressed this strong sentiment.
Click here to download the PDF.
For media commentary contact us on 02 8824 3422 or at [email protected]