Australia’s latest marriage and divorce data

The Australian Bureau of Statistics has released the latest data on marriages and divorces in Australia, including the first data collected on Australian same-sex marriages.
November most popular month for weddings
Across Australia, November is the most popular month of the year to get married (12,576 weddings) closely followed by October (12,263) and March (12,186). The least popular month was June, with only 6,032 weddings taking place which only accounts for 5% of all weddings.
Fewer weddings, more divorces
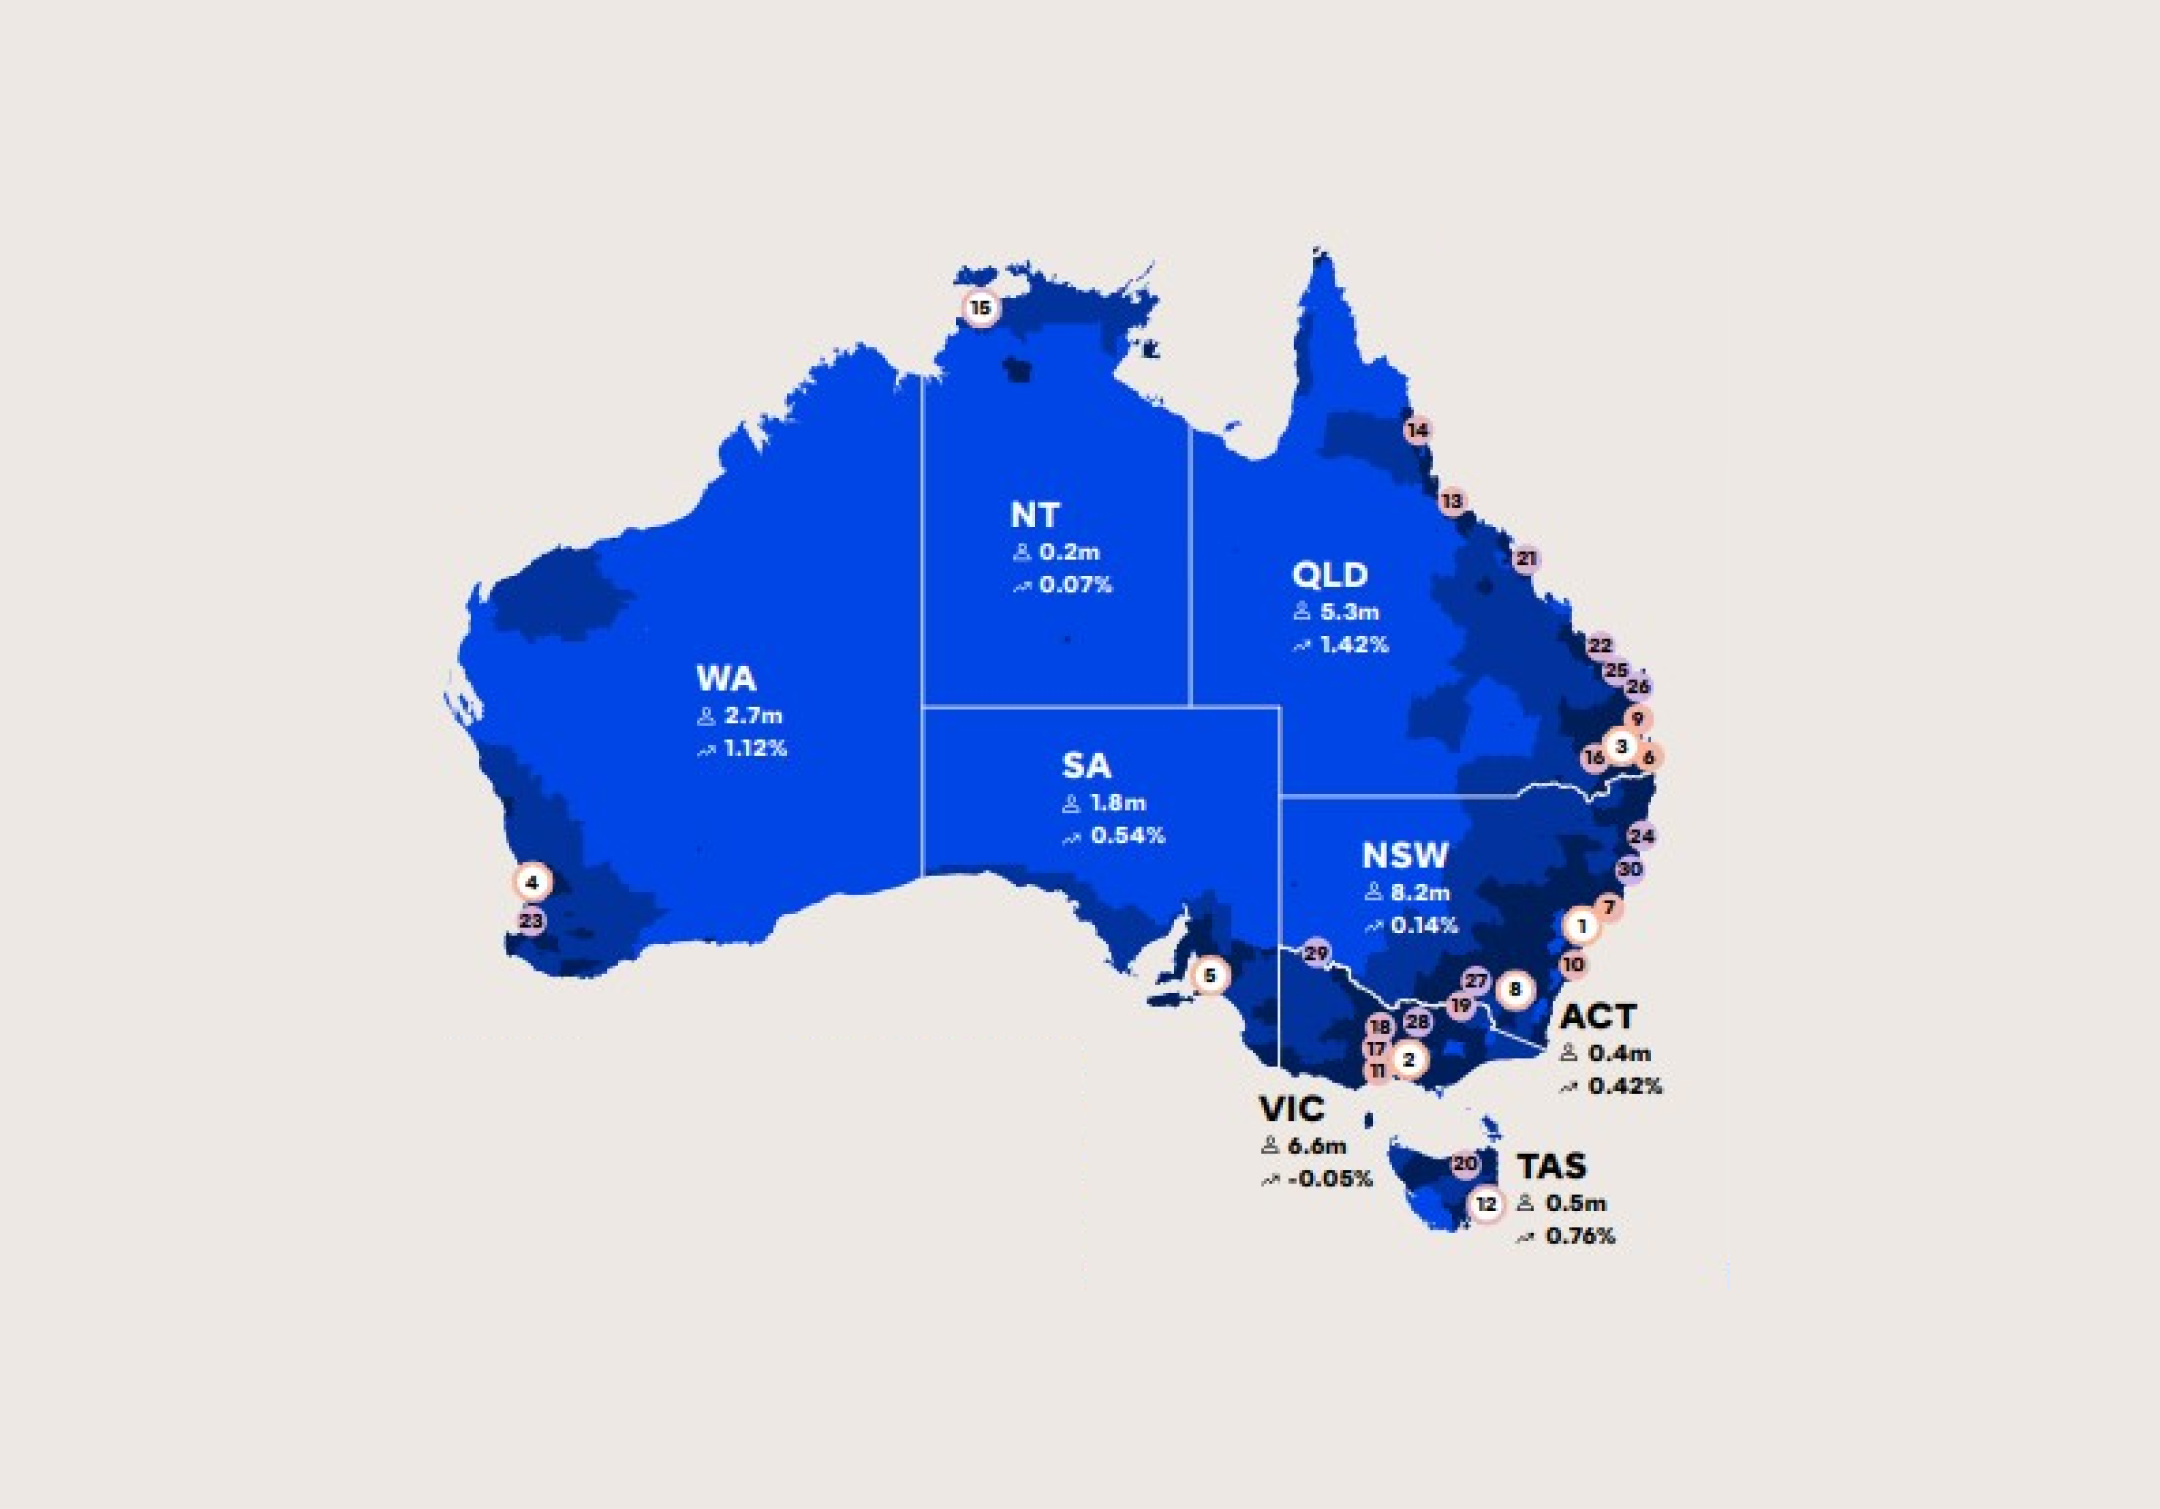
The numbers reveal that in in 2017 there were 112,954 marriages registered in Australia, a 4.7% decrease from 2016. The majority of marriages (79%) were registered in New South Wales, Victoria and Queensland. Over the same period, the number of divorces increased by 5% to 49,032. Victoria saw the largest increase in divorces in 2017, up by 1,698 and inexplicably accounting for 70% of Australia’s 2,428 extra divorces.
While the current divorce rate of 2 divorces per 1,000 people is higher than a year ago, it is much lower than previous decades, being 2.8 in 1997 and 2.3 in 2007. Australia’s current divorce rate is lower than the U.S. divorce rate of 2.5, but higher than in the UK (1.9), China (1.8) and New Zealand (1.7).
Same-sex marriages
In the first data on same-sex marriages, collected from 9 December 2017, when the amendments to the Marriage Act 1961 came into effect, to 30 June 2018, 3,149 same-sex weddings were held in Australia.
The 2016 Census recorded 46,800 same-sex couples and so in just over half a year of the amended Marriage Act, 6.7% of Australia’s same-sex couples have married. More female same-sex marriages occurred (56%) than male same-sex marriages (44%).
The median age of marriage for women is now 30
For the first time in Australia, the median age of marriage for women has reached just over 30 years old, up 0.2 years since 2016. While the median age for men getting married is 32 years, which has been increasing over the age of 30 since 2014.
McCrindle Social Researcher, Geoff Brailey said the increasing median age of marriage is caused by key factors such as the increasing casualisation of the workforce and rising living costs.
“There are shifting expectations to be able to not only earn a full-time wage, but to buy a place before and move out of home before they get married,” he said.
More civil celebrants than ministers of religion
Four out of five weddings in Australia (77%) are conducted by civil celebrants rather than ministers of religion (23%). In Australia there are 3.5 times more registered civil celebrants than ministers of religion (88,061 cf. 24,886).
Source: Australian Bureau of Statistics, November 2018
For media commentary contact us on 02 8824 3422 or at [email protected]