National Education Report: A Snapshot of Schools in Australia in 2013

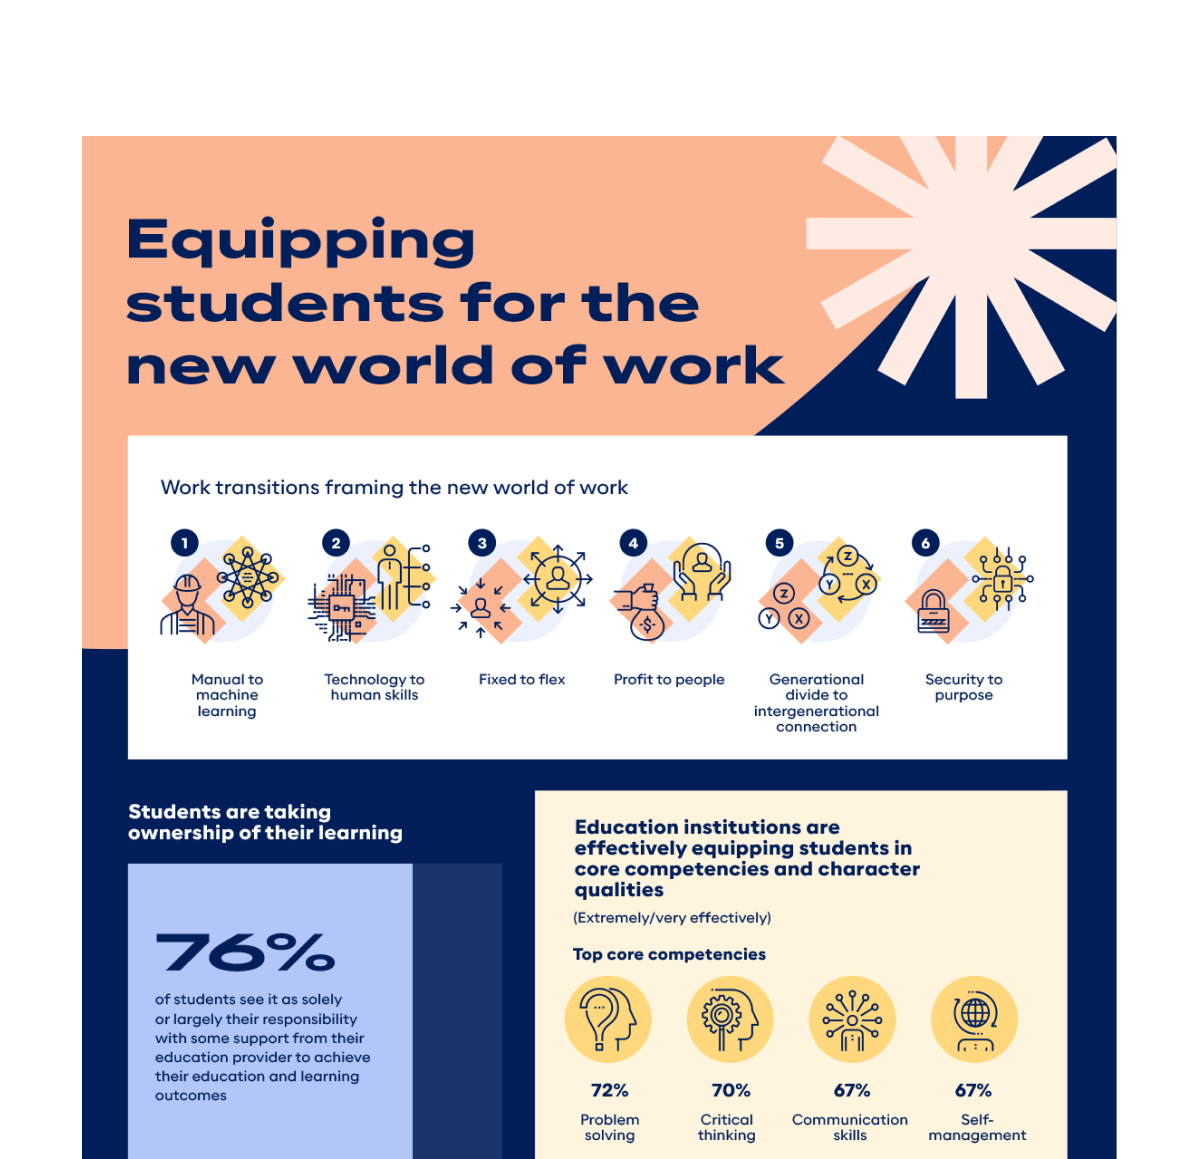
Australians are more educated today than they have been at any other point in history. The number of students completing undergraduate and postgraduate courses today is on the rise and for the first time in Australian history more than half the population aged 15-64 have a post-secondary qualification (51%). Over 70% of the newest wave of high school graduates, Australia’s 4.6 million Generation Zs, are pursuing further education and training, with almost half going on to university. How is today’s education system providing for this Generation of lifelong learners? Here is a snapshot of current and future trends in primary and secondary schools across Australia.
Click here to download the full report.
Students Today
At the beginning of the 2012 school year, there were 3,589,986 students enrolled in Australian schools. This is a 1.4% increase from enrolments in the previous year, and a significant 5.5% increase from 2006. From 2011-2012, most of these increases were attributed to growing enrolment of students in primary schools (2.0% increase). The largest increase in student numbers across Australia occurred in Queensland (2.1%) and the only decrease across the states was found in Tasmania (ABS cat. 4221.0, Schools, 2012).
From primary schools through to the early years of secondary schools, there is a fairly constant proportion of male versus female students, with the proportion of male students two percent higher than females. In Year 11 this trend reverses, and by Year 12, there are are 3% more female students. This trend continues into higher education where there are a higher proportion of females than males completing undergraduate and postgraduate qualifications (ABS Census 2011).
Public versus Private Education
Since the 1970s there has been a significant rise in the proportion of students enrolling in non-government schools. Whereas non-government schools educated only 22% of all students in 1970, by 2012 that figure had risen to 35% (ISCA, 2012). The fact that more than 2 in 5 high school students are sent to Independent non-government schools is part of a broader trend towards paying for services which were once government provisions. From private hospitals to the privatization of public transport options and even the growth of toll roads, Australians are increasingly likely to pay for something that they value.
In 2012, in continuation with trends from previous year, Independent schools continued to observe the greatest proportional increase of student enrolment. While government schools continue to educate the majority of Australian students (2,342,379 students, that is 65%), there were 736,595 students (21%) enrolled in Catholic schools and 511,012 students (14%) enrolled in the Independent school sector.
The percentage of students enrolled in government schools in 2012 was greatest in the Northern Territory, where 73.6% of all students attend government schools, and least in the ACT, where just over half (57.3%) of students attend government schools. Australians value choice, and today’s parents are prepared to pay for an education if they feel it will align more closely with their values, expectations, and aspirations.
Schools: Bricks and Mortar
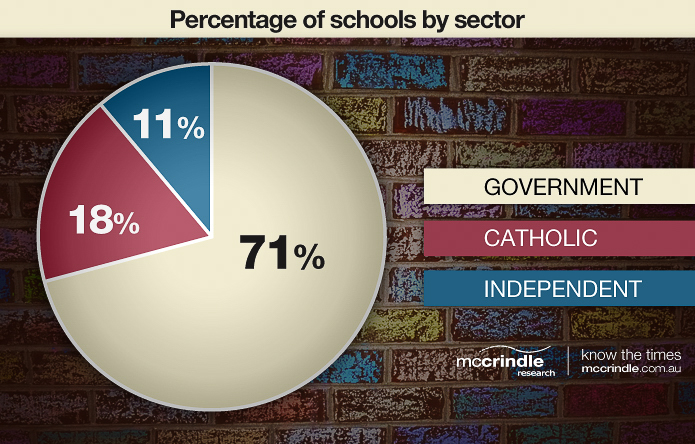
In 2011 there were 9,435 schools in Australia, including primary, secondary, combined and special schools. 71% of these were government schools (6,705), 18% were Catholic schools (1.710) and 11% were Independent schools (1,020). Most independent schools (84%) have a religious affiliation with 75.1% being Christian and 9% a religious affiliation other than Christianity. The remainder of independent schools comprise of special schools, international schools, indigenous schools, and community schools (ABS cat. 4221.1, Schools, Australia 2011; ISCA, Snapshot, 2012).
The greatest proportion of independent schools was in Western Australia (13%) and the least in Victoria (9%). The proportion of Catholic schools varied more significantly, with the greatest proportion of Catholic schools in the ACT (23%) and the least in the Northern Territory (8%).
While the total number of students across all sectors has increased in a generation, the proportion of Independent and Catholic schools in Australia is increasing. In 2001, Catholic and Independent schools made up 27.7% of total schools in Australia. Ten years later, in 2011, they made up 28.9% of schools. Since 1985, the increase in students at independent schools has grown by 5 times the increase in government schools (298,844 compared to 64,152). Since 1985 the Australian population has increased more than 40%, and the number of babies born is breaking new records (now exceeding 300,000 per year). This has resulted in a growth of students in schools at all levels and across all sectors.
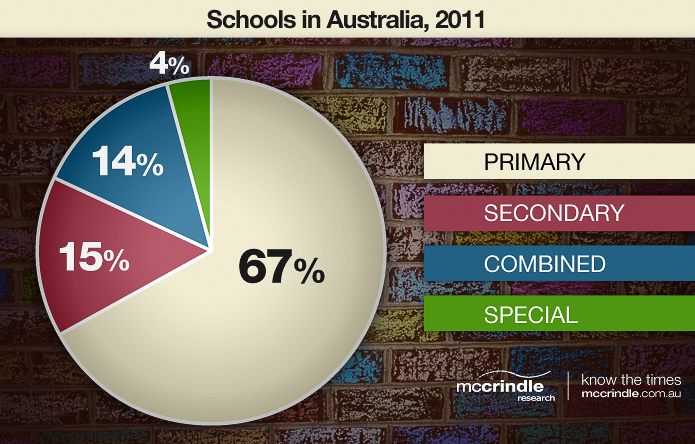
The figures above represent the percentage of primary, secondary, combined and special schools within Australia. Combining government and non-government schools, there were 6312 primary schools, 1397 secondary schools, 1306 combined schools, and 420 special schools around the country. Of these, 77% of primary schools, 73% of secondary schools, and 79% of special schools belonged to the government sector. In contrast to this, a significant 61% of combined schools were a part of the non-government sector.
Teachers: Education’s Lifeblood
The challenge for the education sector, which has an ageing workforce, is to attract and retain Generation Y teachers. The top 5 attraction and retention factors that Gen Y want are what schools have to offer, but schools need to get better at communicating these. These factors are work-life balance, a social workplace culture, a varied and interesting job description, career progression opportunities and ongoing training. In 2011, there were 255,110 full-time equivalent teaching staff over primary and secondary schools in Australia. Of these, 165,272 (65%) were government school teaching staff, 48 393 (19.0%) were Catholic school teaching staff, and 41,445 (16%) were independent school teaching staff.
Australia’s teaching staff are predominantly female (65%). The ratio of male to female teachers has decreased over the last 15 years. In 1997, 7 out of every 20 teachers was male. By 2011, the number of male teachers had dropped to 6 out of every 20 teachers. Government schools have a lower percentage of male teachers (28.7%) compared to Catholic schools (30.6%) and Independent schools (36.2%).
There are significantly more male teachers at secondary levels of education that at primary. In government primary schools in 2011, 19% of staff were male, and in non-government primary schools, 20% of staff were male. In government secondary schools, 40.8% of teaching staff were male; in non-government secondary schools, 43.2% were male (ABS cat. 4221.0 Schools, Australia, 2011).
Student-Teacher Ratio on Decline
Between 1997 and 2011, we have seen an 18.8% increase in the total number of FTE teaching staff. This increase in teacher staffing corresponds with a decrease in the teacher to student ratio in both government and non-government schools. The national average FTE student-teacher ratio in both secondary and primary schools during 2011 was 13.8. Across all primary schools, this ratio was 15.6, with a ratio of 15.3 in government schools, 17.5 in Catholic schools, and 14.8 in Independent schools.
The student-teacher ratio was slightly lower in secondary schools, with a 12.0 ratio across the board. Independent schools again had the lowest ratio at 10.4 FTE teaching staff per student, whereas the Catholic schools had 12.8 and government schools 12.2 (ABS cat. 4221.0, 2011).
The education offered by Australian schools is internationally regarded as one of the world’s best. Additionally, teachers in Australia have been amongst the most innovative professionals in responding to the technological and generational shifts Australia has experienced over the last 3 decades. The strengths and challenges, however, maintaining a world-class, relevant, and technologically innovative education system for the decades ahead.