National Education Report: A Snapshot of Schools in Australia in 2015

 Australians are more educated today than they have been at any other point in history. The number of students completing undergraduate and postgraduate courses today is on the rise and for the first time in Australian history more than half the population aged 15-64 have a post-secondary qualification (51%). Over 70% of the newest wave of high school graduates, Generation Z, are pursuing further education and training, with almost half of them going on to university. How is today’s education system providing for this Generation of lifelong learners? Here is a snapshot of current and future trends in primary and secondary schools across Australia.
Students Today
At the beginning of the 2014 school year, there were 3,694,101 students enrolled in Australian schools. This is a 1.3% increase from enrolments in the previous year, and a significant 7.5% increase from 2007. From 2013-2014, most of these increases were attributed to growing enrolment of students in (government) primary schools (2.1% increase). The largest increase in student numbers across Australia occurred in the ACT (1.9%) followed by Victoria (1.8%) while South Australia enrolments decreased (ABS cat. 4221.0, Schools, 2014). From primary schools through to the early years of secondary schools, there is a fairly constant proportion of male to female students, with the proportion of male students two percent higher than females, which reflects the population differentials. In Year 11 this trend reverses, and by Year 12 there are 3% more female students. This trend continues into higher education where there is a higher proportion of females than males completing undergraduate and postgraduate qualifications (ABS Census 2011).
Public versus Private Education
Since the 1970s there has been a significant rise in the proportion of students enrolling in non-government schools. Whereas non-government schools educated only 22% of all students in 1970, by 2014 that figure had risen to just under 35% (ABS cat. 4221.0, Schools, 2014). The fact that almost 2 in 5 high school students are sent to Independent non-government schools is part of a broader trend towards paying for services which were once government provisions. From private hospitals to the privatisation of public transport options and even the growth of toll roads, Australians are increasingly prepared to pay for something that they value. In 2014, in continuation with trends from previous years, Independent schools continued to observe the greatest proportional increase of student enrolment. While government schools continue to educate the majority of Australian students (2,406,495 students, which equates to 65%), there were 757,749 students (21%) enrolled in Catholic schools and 529,857 students (14%) enrolled in their Independent school sector.
The percentage of students enrolled in government schools in 2014 was greatest in the Northern Territory, where 72.5% of all students attend government schools, and least in the ACT, where just over half (57.8%) of students attend government schools. Australians value choice, and today’s parents are prepared to pay for an education if they feel it will align more closely with their values, expectations, and aspirations.
Schools: Bricks and Mortar
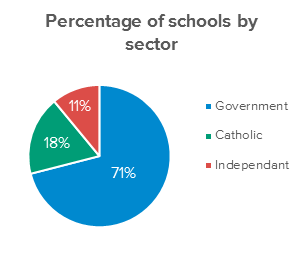 In 2014 there were 9,389 schools in Australia, including primary, secondary, combined and special schools. 71% of these were government schools (6,651), 18% were Catholic schools (1,722) and 11% were Independent schools (1,016). Most independent schools (85%) have a religious affiliation with 75.1% being Christian and 9% a religious affiliation other than Christianity. The remainder of independent schools comprise special schools, international schools, indigenous schools, and community schools (ABS cat. 4221.0, Schools, Australia 2013; ISCA, Snapshot, 2014).
The greatest proportion of independent schools was in Western Australia (13%) and the least in Victoria (9%). The proportion of Catholic schools varied more significantly, with the greatest proportion of Catholic schools in the ACT (23%) and the least in the Northern Territory (9%).
While the total number of students across all sectors has increased in a generation, the proportion of Independent and Catholic schools in Australia is increasing. In 2001, Catholic and Independent schools made up 27.7% of total schools in Australia. Twelve years later, in 2013, they made up 29.1% of schools. Since 1985, the increase in students at independent schools has grown by 5 times the increase in government schools (298,844 compared to 64,152). Since 1985 the Australian population has increased more than 40%, and the number of babies born is breaking new records (now exceeding 300,000 per year). This has resulted in a growth of students in schools at all levels and across all sectors.
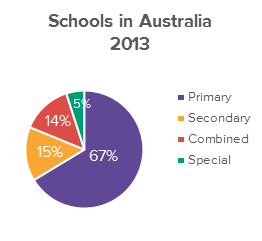 This figure to the right represents the percentage of primary, secondary, combined and special schools in Australia. In total there are 6256 primary schools, 1385 secondary schools, 1321 combined schools and 435 special schools around the country. Of these, 77% of primary schools, 74% of secondary schools, and 76% of special schools belonged to the government sector. In contrast to this, a significant 62% of combined schools were a part of the non-government sector.
Teachers: Education’s Lifeblood
The challenge for the education sector, which has an ageing workforce, is to attract and retain Generation Y teachers. The top 5 attraction and retention factors that Gen Y want are what schools have to offer, but schools need to get better at communicating these. These factors are work-life balance, a social workplace culture, a varied and interesting job description, career progression opportunities and ongoing training. In 2014, there were 264,065 full-time equivalent teaching staff over primary and secondary schools in Australia. Of these, 169,199 (64%) were government school teaching staff, 50,936 (19%) were Catholic school teaching staff, and 43,930 (17%) were independent school teaching staff.
Government schools have a lower percentage of male teachers (27.6%) compared to Catholic schools (29.9%) and Independent schools (35.7%).
There are slightly more male teachers at secondary levels of education that at primary. In government primary schools in 2014, 18.5% of staff were male, and in non-government primary schools, 19.7% of staff were male. In government secondary schools, 39.9% of teaching staff were male; in non-government secondary schools, 42.6% were male (ABS cat. 4221.0 Schools, Australia, 2014).
Student-Teacher Ratio on Decline
Between 1997 and 2011, we have seen an 18.8% increase in the total number of FTE teaching staff. This increase in teacher staffing corresponds with a decrease in the teacher to student ratio in both government and non-government schools. The national average FTE student-teacher ratio in both secondary and primary schools during 2014 was 13.9. Across all primary schools, this ratio was 15.6, with a ratio of 15.4 in government schools, 17.2 in Catholic schools, and 14.7 in Independent schools.
The student-teacher ratio was slightly lower in secondary schools, with a 12.1 ratio across the board. Independent schools again had the lowest ratio at 10.3 FTE teaching staff per student, whereas the Catholic schools had 12.8 and government schools 12.5 (ABS cat. 4221.0, 2014).
The education offered by Australian schools is internationally regarded as one of the world’s best. Additionally, teachers in Australia have been amongst the most innovative professionals in responding to the technological and generational shifts Australia has experienced over the last 3 decades. The strengths and challenges, however, maintaining a world-class, relevant, and technologically innovative education system for the decades ahead.
Research Solutions for the Education Sector
At McCrindle we have a passion for helping schools and tertiary institutions thrive in today’s changing times. The education sector sits at the very heart of our diverse Australian communities and is also at the cross-roads of today’s biggest trends – dealing with massive technological change and engaging with the youngest generations.
21st Century students are being shaped in different times and have different characteristics, expectations, and communication styles – therefore engaging effectively with today’s students and their families requires new strategies, solutions, and approaches.
At McCrindle, we provide a range of innovative research solutions to assist schools and tertiary institutions in understanding their student, parent, and staff communities. From school satisfaction research to future of education model testing, from professional development sessions to executive strategic planning sessions, and from annual report design to infographic visualisation, we are able to assist education providers to know the times.