2016 Census shows a growing, ageing, and more culturally diverse Australia


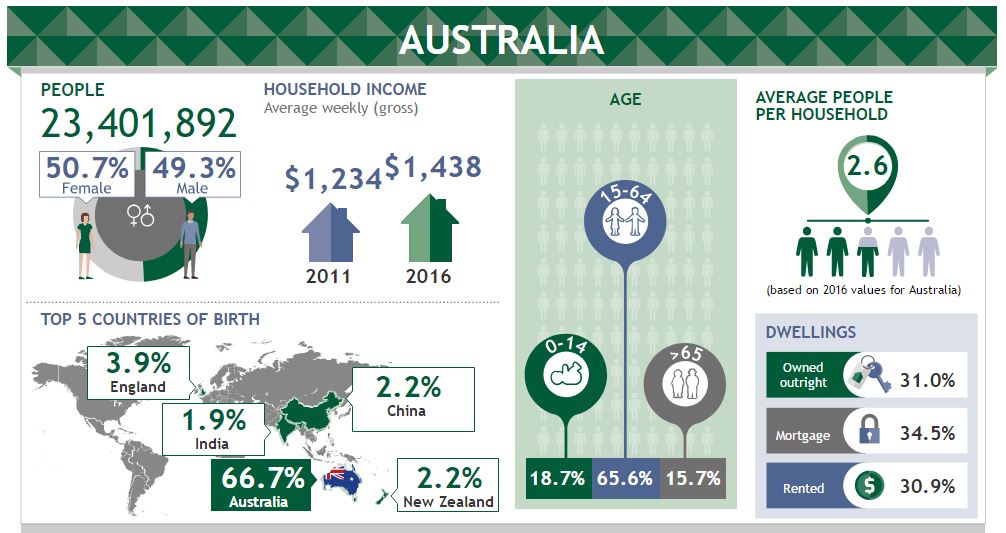
Source: The Australian Bureau of Statistics Infographic
The Census results, released by the Australian Bureau of Statistics today, reveal a picture of a changing Australia. Our nation is larger, older, more culturally diverse and less religious than at any other time in history.
A nation of 24.6 million and growth of 8.8% since the 2011 Census
On Census night in 2016, 23.4 million individuals who normally live in Australia were counted – an 8.8% increase from 2011. This doesn’t include the 300,000 visitors, or the 600,000 Australians who were overseas at the time. As at 31 December 2016, the ABS estimates a total population of 24.4 million (and today it is 24.6 million).
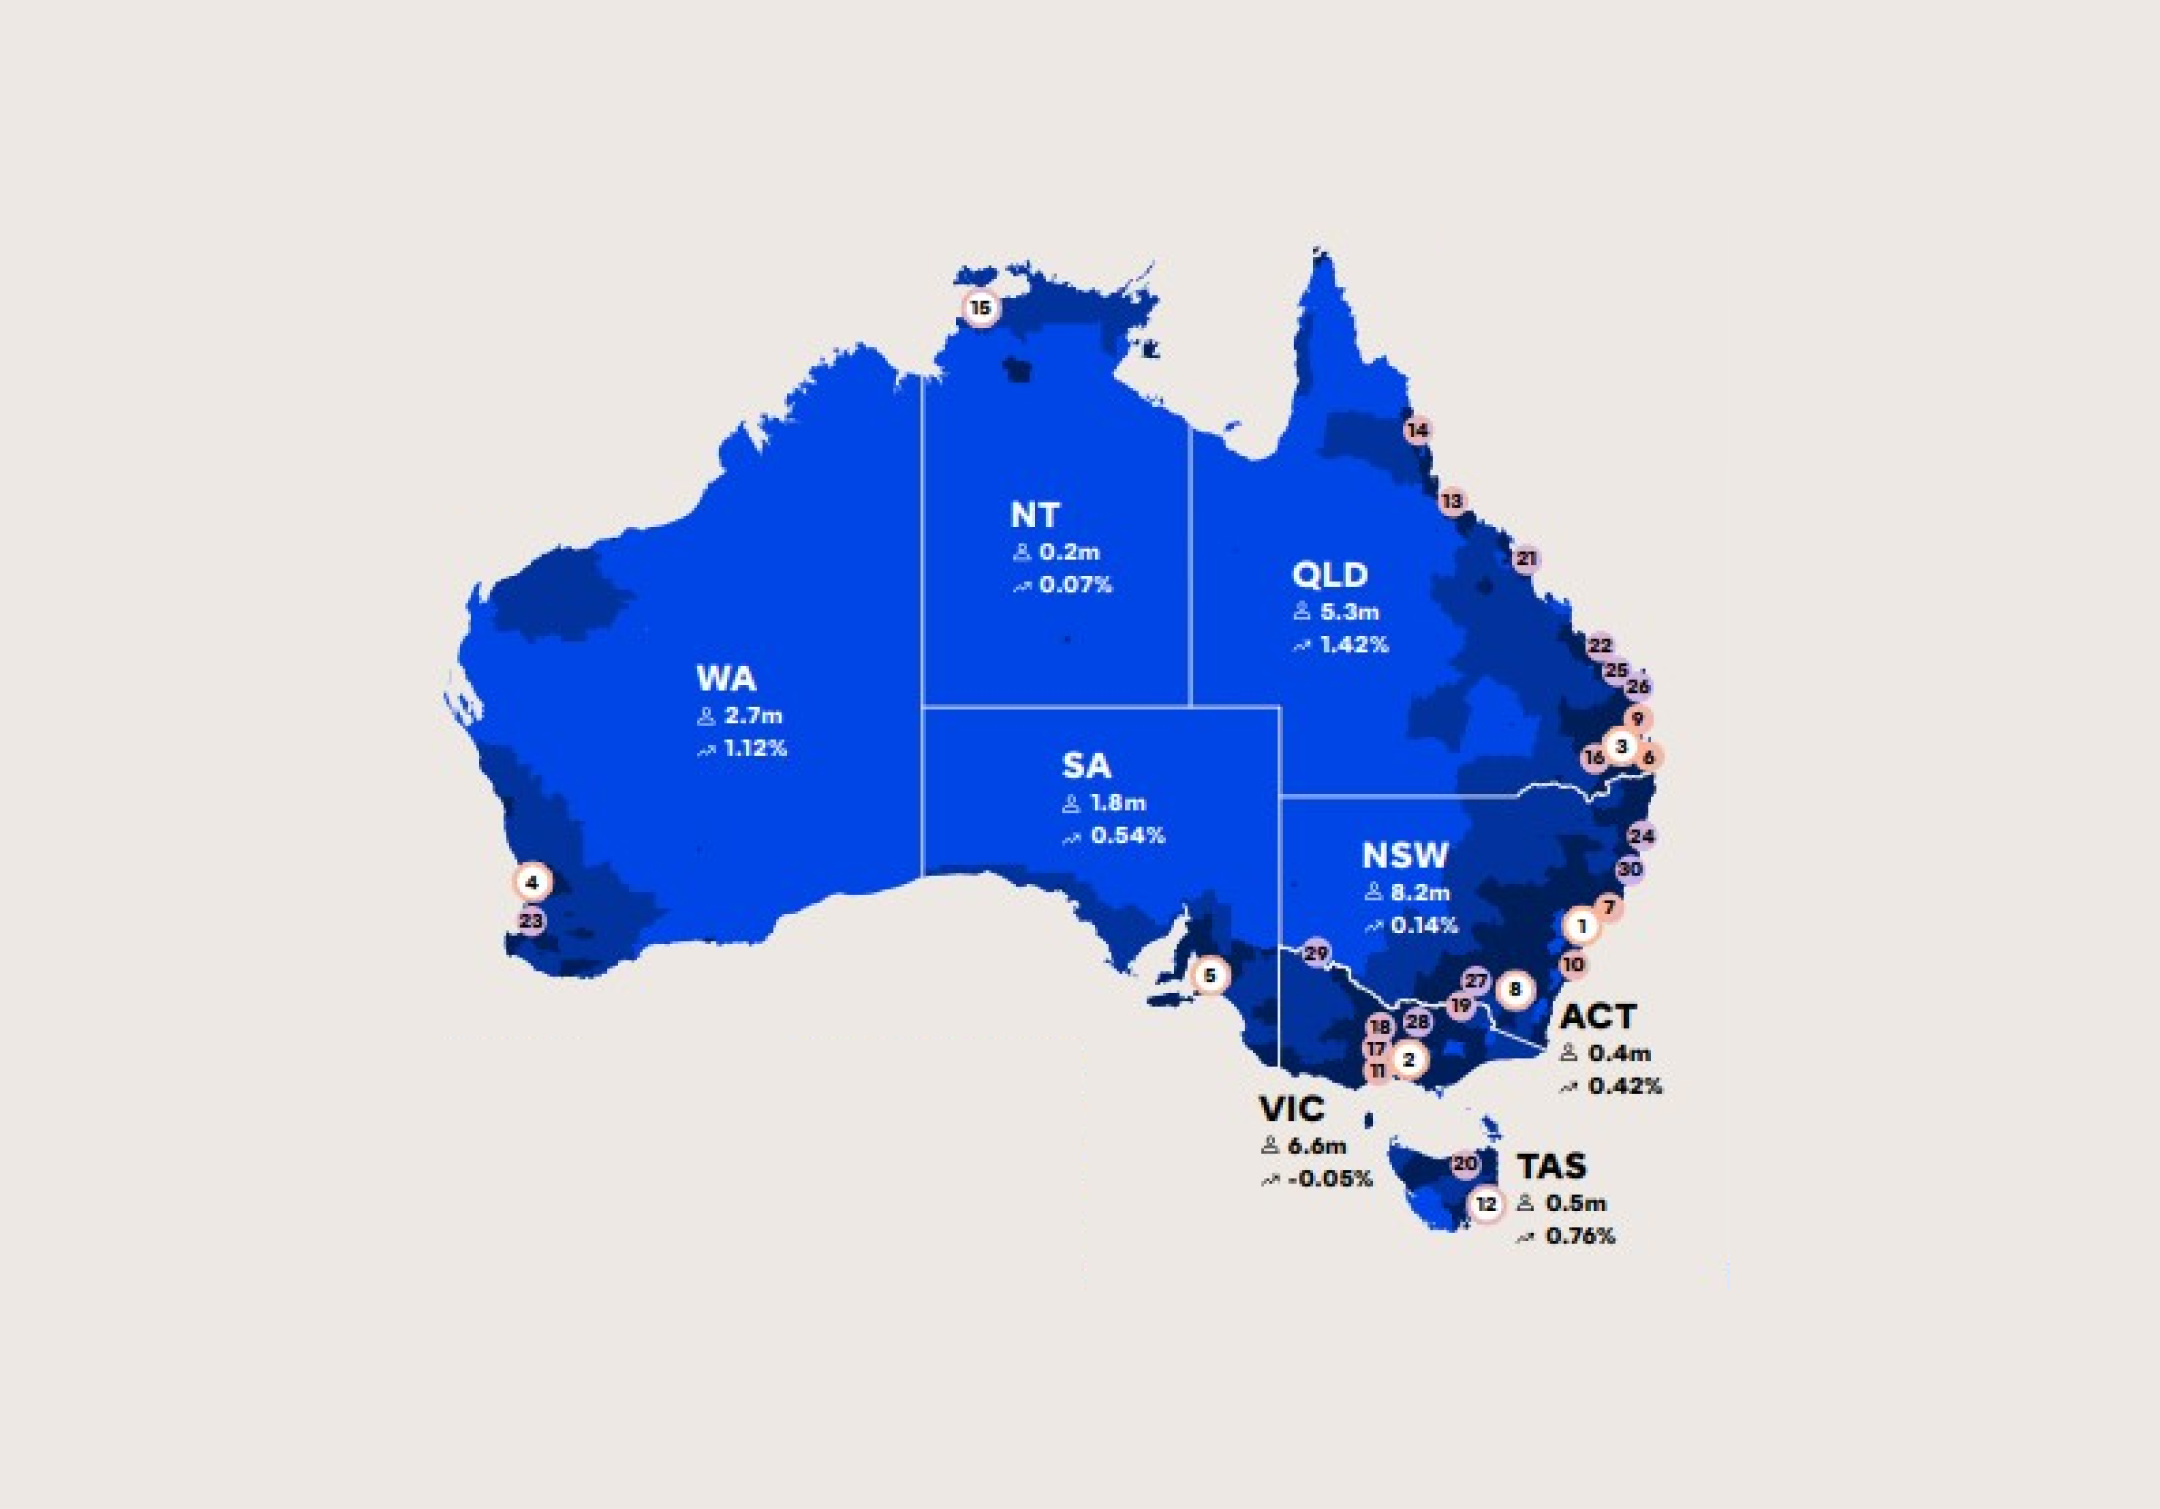
While New South Wales (7.5 million) and Victoria (5.9 million) remain our largest states, the fastest growing states were the ACT (11.2% growth), followed by Victoria (10.7%) and Western Australia (10.5%).
Cities absorb most of Australia’s growth
Two thirds (67%) of our nation lives in Australia’s capital cities, which have grown twice as fast as the rest of Australia over the past five years (10.5% compared to 5.7% for the remainder of Australia).
Our biggest capital city remains Sydney (4.8 million) which has grown 9.8% in five years, while Melbourne (4.4 million) is not far behind and edging closer with 12.1% growth. Our fastest growing cities since 2011 have been Darwin (14% growth), Melbourne (12%) and Perth (12%).
Migration is the key growth driver, led by migrants from China and India
1.3 million new migrants from 180 nations have come to call Australia home since 2011, with most of them settling in Sydney and Melbourne. Of the more than 6 million migrants who call Australia home, 18% have arrived since the start of 2012.
China (191,000 migrants; 14.4% growth) and India (163,000 migrants; 12.3% growth) are the top places of birth for migrants since 2011. This is followed by migrants from the UK (8.3% growth), New Zealand (7.4% growth) and the Philippines (4.9% growth).
Nearly half of us are ‘first’ or ‘second’ generation Aussies
Migration has changed Australia’s cultural landscape. 26.3% of Australians are now born overseas (up from 24.6% in 2011). Australians are most likely to have had at least one parent born overseas (both parents Australian born has declined from 50.0% to 47.3%).
While most Australians (73%) speak only English at home, more than a fifth of Australians (21%) speak one of the 300 or more languages spoken across our nation. Mandarin (2.5%), Arabic (1.4%), Vietnamese (1.2%), and Cantonese (1.2%) are the most commonly spoken languages.
The top places of birth of all Australians who were born outside of Australia are England (3.9%, down from 4.2% in 2011), New Zealand (constant at 2.2%), China (2.2%, up from 1.5% in 2011), India (1.9%, up from 1.4% in 2011) and the Philippines (1.0%, up from 0.8%). European migrants tend to be much older than Asian born migrants, who are more likely to have come in recent years and are therefore younger.
Not only growing, but ageing
Australia has developed a middle-age spread as our population is ageing. As the proportion of the population aged over 50 has grown, the child and teenage population as a proportion has decreased. Those aged 65+ now represent 16% of the population (up from 14% in 2011). In Tasmania, Australia’s oldest state, almost one in five residents are aged 65 or older. Since 2011, the median age of an Australian has increased from 37 to 38.
Rise in single households
Since 2011, family households have declined in their proportion of all households (71.3% down from 71.5%), while single parent households have risen (from 24.3% to 24.4%), along with group households (from 4.1% to 4.3%).
Aboriginal and Torres Strait Islander population increased
Almost 650,000 individuals of Aboriginal and/or Torres Strait Islander origin were recorded in the Census, comprising 2.8% of our population nationally. This is an increase of 18% since 2011 and a doubling since 1996. More than 3 in 5 of Australia’s recorded Aboriginal and Torres Strait Islander population lives in New South Wales (33%) and Queensland (29%).
‘No religion’ the largest category of religion for the first time
Australia remains a predominantly religious country, with 60% reporting religious affiliation. More than half of Australians affiliate with Christianity (52%, down from 61% in the 2011 Census) while those who adhere to other religions (8%) has remained constant.
Islam (2.6%, increasing from 2.2% in 2011), Buddhism (2.4%; decreasing from 2.5%), Hinduism (1.9%; increasing from 1.3%), Sikhism (0.5%; increasing from 0.3%), and Judaism (0.4%; decreasing from 0.5%) are Australia’s largest ‘other’ religions.
‘No religion’ is now the single largest religious affiliation at 29.6% (larger than the most prominent Christian affiliation of Catholic at 22.6%), up from 21.8% in 2011.
Growing cost of living pressures in capital cities
Average household weekly incomes increased by 16.5%, from $1,234 in 2011 to 1,438. However, over the same period, median weekly rents increased by 17.5% (from $285 to $335 today). Median rent is highest in Sydney ($440/week) and Darwin ($420/week).
The proportion of Australians renting has increased to 30.9% (up from 29.6% in 2011), while 34.5% own their home with a mortgage (down from 34.9%) and 31% own outright (down from 32.1%).
Median mortgage repayments are highest in Sydney, Darwin, and Canberra, where mortgage repayments are well over $2,000 per month. Perth, Sydney & Melbourne have the highest proportion of mortgage holders who spend more than 30% of their income on their mortgage.
More than 1 in 5 Sydneysiders face ‘rental stress’ or ‘mortgage stress’
The housing crisis is greatest in Australia’s largest city. 8% of Sydneysiders face mortgage stress (paying more than 30% of their pre-tax income on their mortgage), and a further 14% face rental stress (paying more than 30% of their income to the landlord). Combined, 22% of Sydneysiders face significant housing affordability challenges.
Car ownership up
The proportion of households with no motor vehicles declined from 8.6% in 2011 to 7.5% in 2016. The proportion of households with two or more vehicles increased from 52.6% to 54.3%. While internet connections from home have increased since 2011, 14.1% of Australian households still do not access the internet from their dwelling.
For media commentary contact us on 02 8824 3422 or at [email protected]


