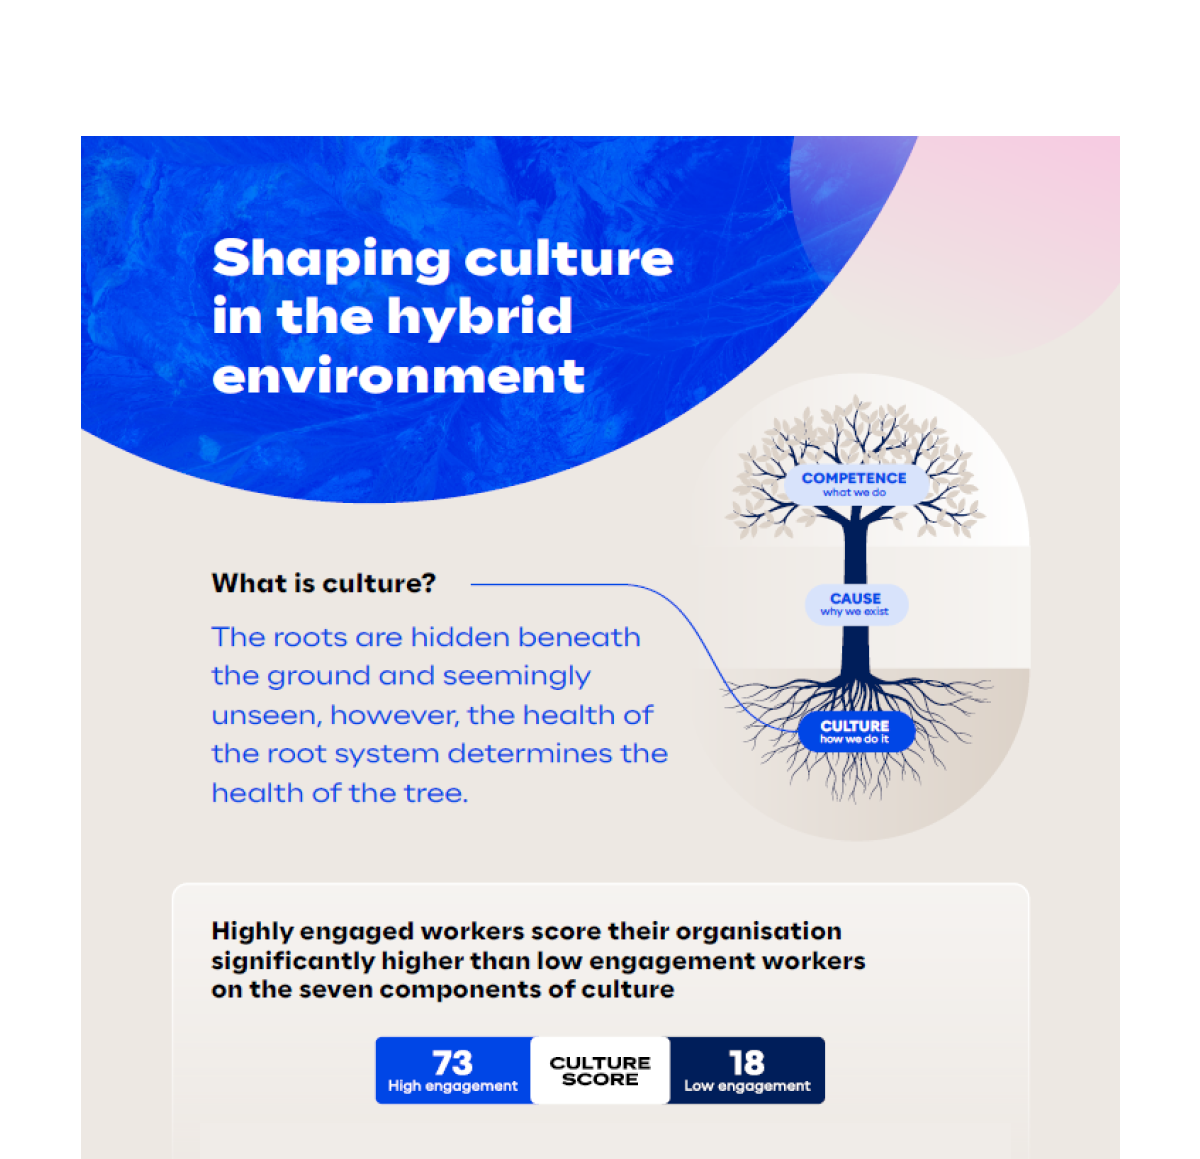
fbpx

Design

Visual communication is increasingly important in the digital age. Utilise the power of visual design to communicate data with clarity, articulate complex ideas, and break data down into digestible information. We take complex information and crystallise it into simple stories so you can make faster, more confident decisions.

Infographic design

We love bringing data to life by making data visual. It aligns with the old adage, a picture is worth a thousand words, which is helpful when working with a lot of numbers. We take complex data and turn it into easy to understand infographics. The result? Simple and shareable insights, communicated in visually engaging ways that are clear and compelling.

Report design

Report design

Get visual, story driven reports that share findings in a comprehensive format and explain even the most complicated ideas with stunning clarity. Our visual reports have a proven track record of engagement that makes readers want to keep reading.

Interactive mapping

Interactive mapping visualises location based trends and allows you to interact with maps for greater insight into the data. In a sea of data, see the trends in interactive maps along with other patterns and relationships based on spatial analysis.

Dashboard design

Combine the power of visualisation with the utility of dashboards to display your data for ongoing use. Let us collect your data and configure it in an easy to use dashboard so you can have key metrics at your fingertips for ongoing use.

Shaping thriving culture infographic

Get the key insights and stats on how leaders can shape thriving cultures in decentralised environments in this handy infographic.

Ready to bring your data to life?

Have no product in the cart!
0