ARTICLE
The not-for-profit landscape

Australia’s not-for-profit sector is at the heart of our national identity and is made up of a wide variety of charities. In this article, we provide an overview of the NFP landscape as well as key trends in donor behaviour.
There are over 59,000 registered charities that employ 1.42 million people with an estimated 3.2 million volunteers. The Australian charities sector is extremely diverse and comprises a range of sectors. The biggest proportion are religious charities (21.5%). The next largest charity sector is that of Human Services at 15.9% followed closely by Education (15.6%).
Giving practices in Australia
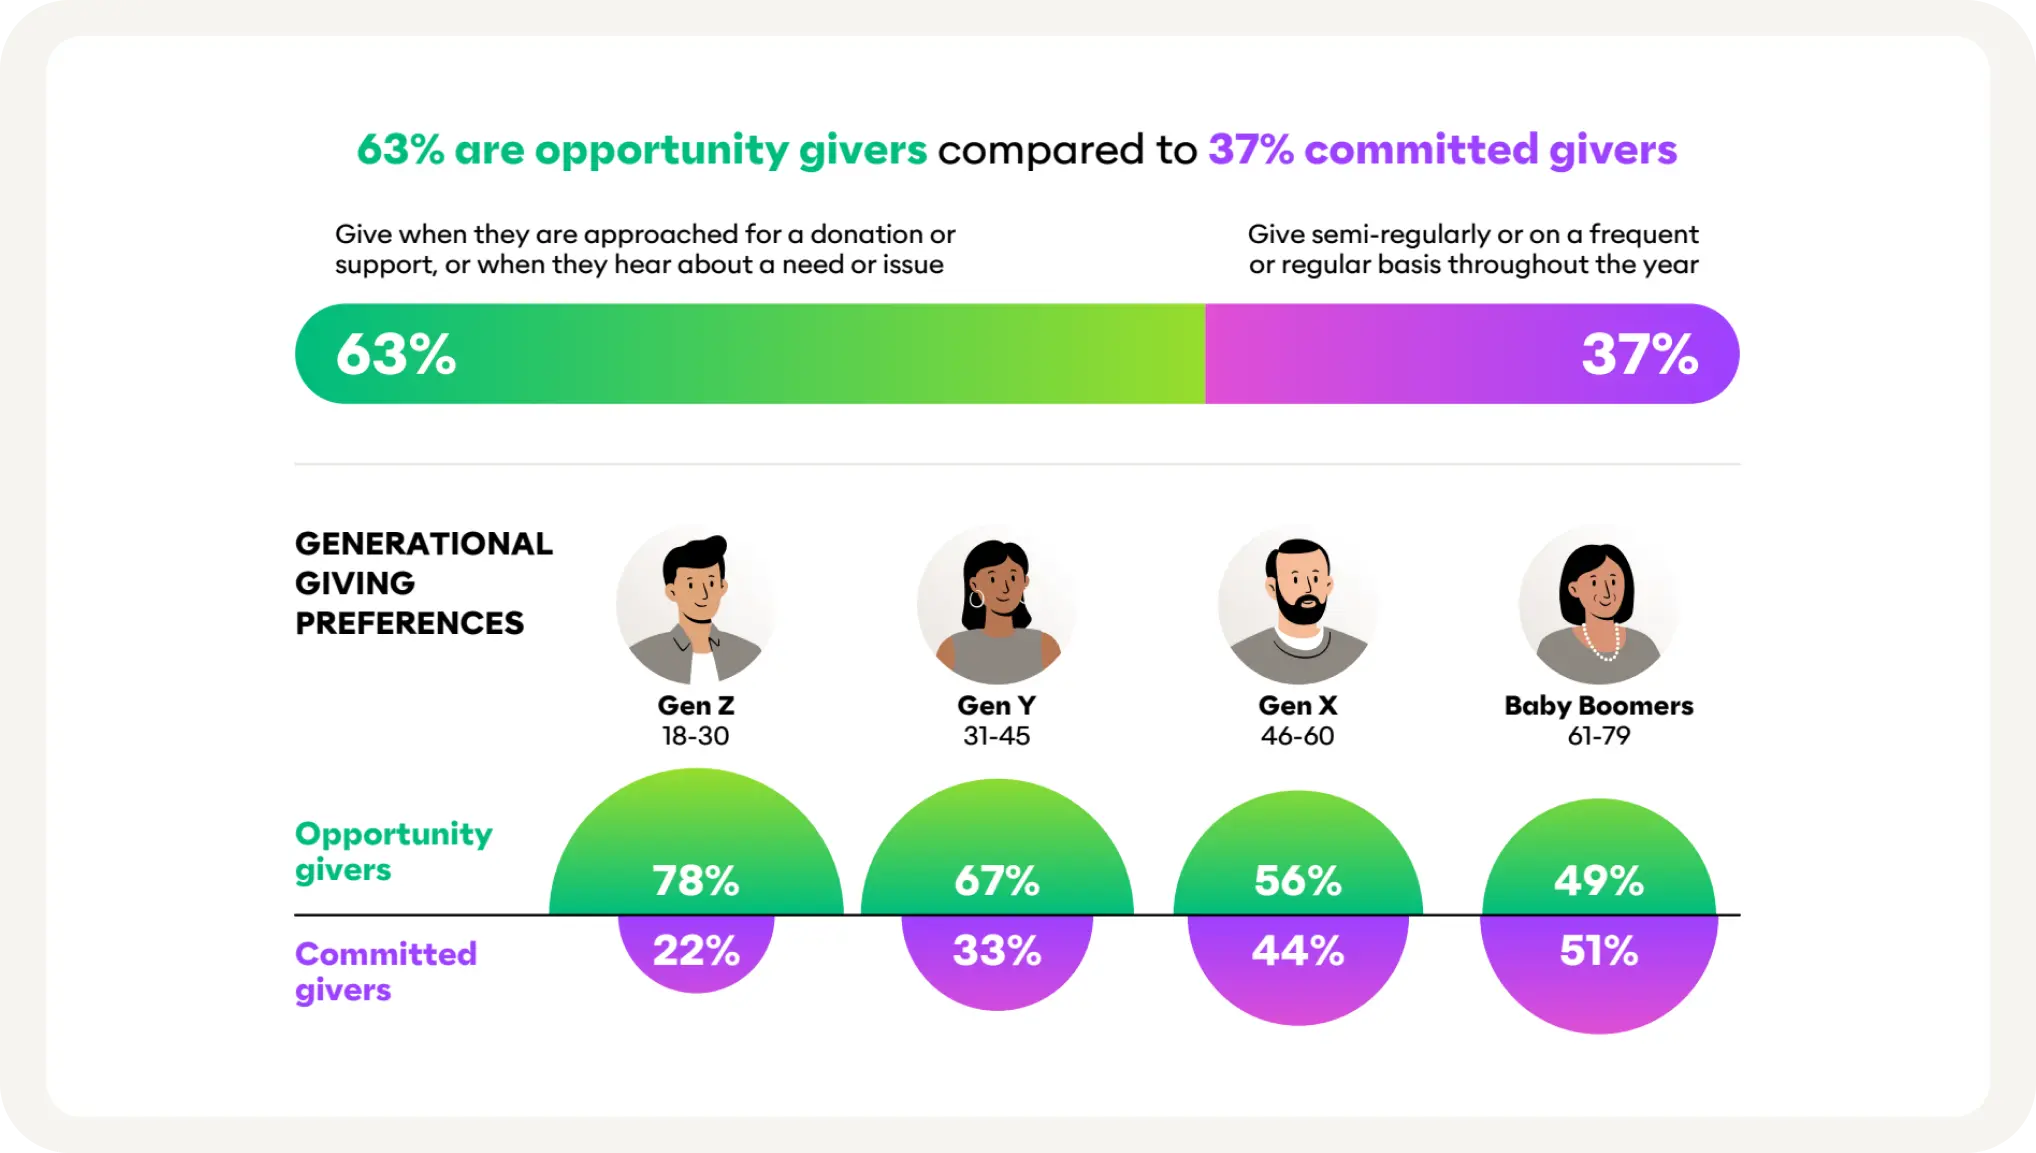
Three in four Australians (76%) give financially to a charity or not-for-profit, down from 84% in 2024. Stable donation bases are shifting. A growing trend shows donors moving from committed giving patterns towards more spontaneous, need-driven giving. Among donors, 63% are opportunity givers, compared to 37% who are committed givers. As has been the case for a while, the younger generations are more likely than their older counterparts to be opportunity givers. Gen Z are most likely to be an opportunity givers compared with Baby Boomers who are more likely to be committed givers.
What charities are Australians most movitated to support?
Children’s charities rank #1 as the cause or charity that Australians are most motivated to support. Followed by medical and cancer research and mental health. This remains consistent with last year. There is an interesting nuance when this is segmented by generation. Gen Z are most likely to support a mental health charity, Gen Y and Gen X are most likely to support children’s charities, consistent with the national average. And Boomers are most likely to support medical and cancer research.
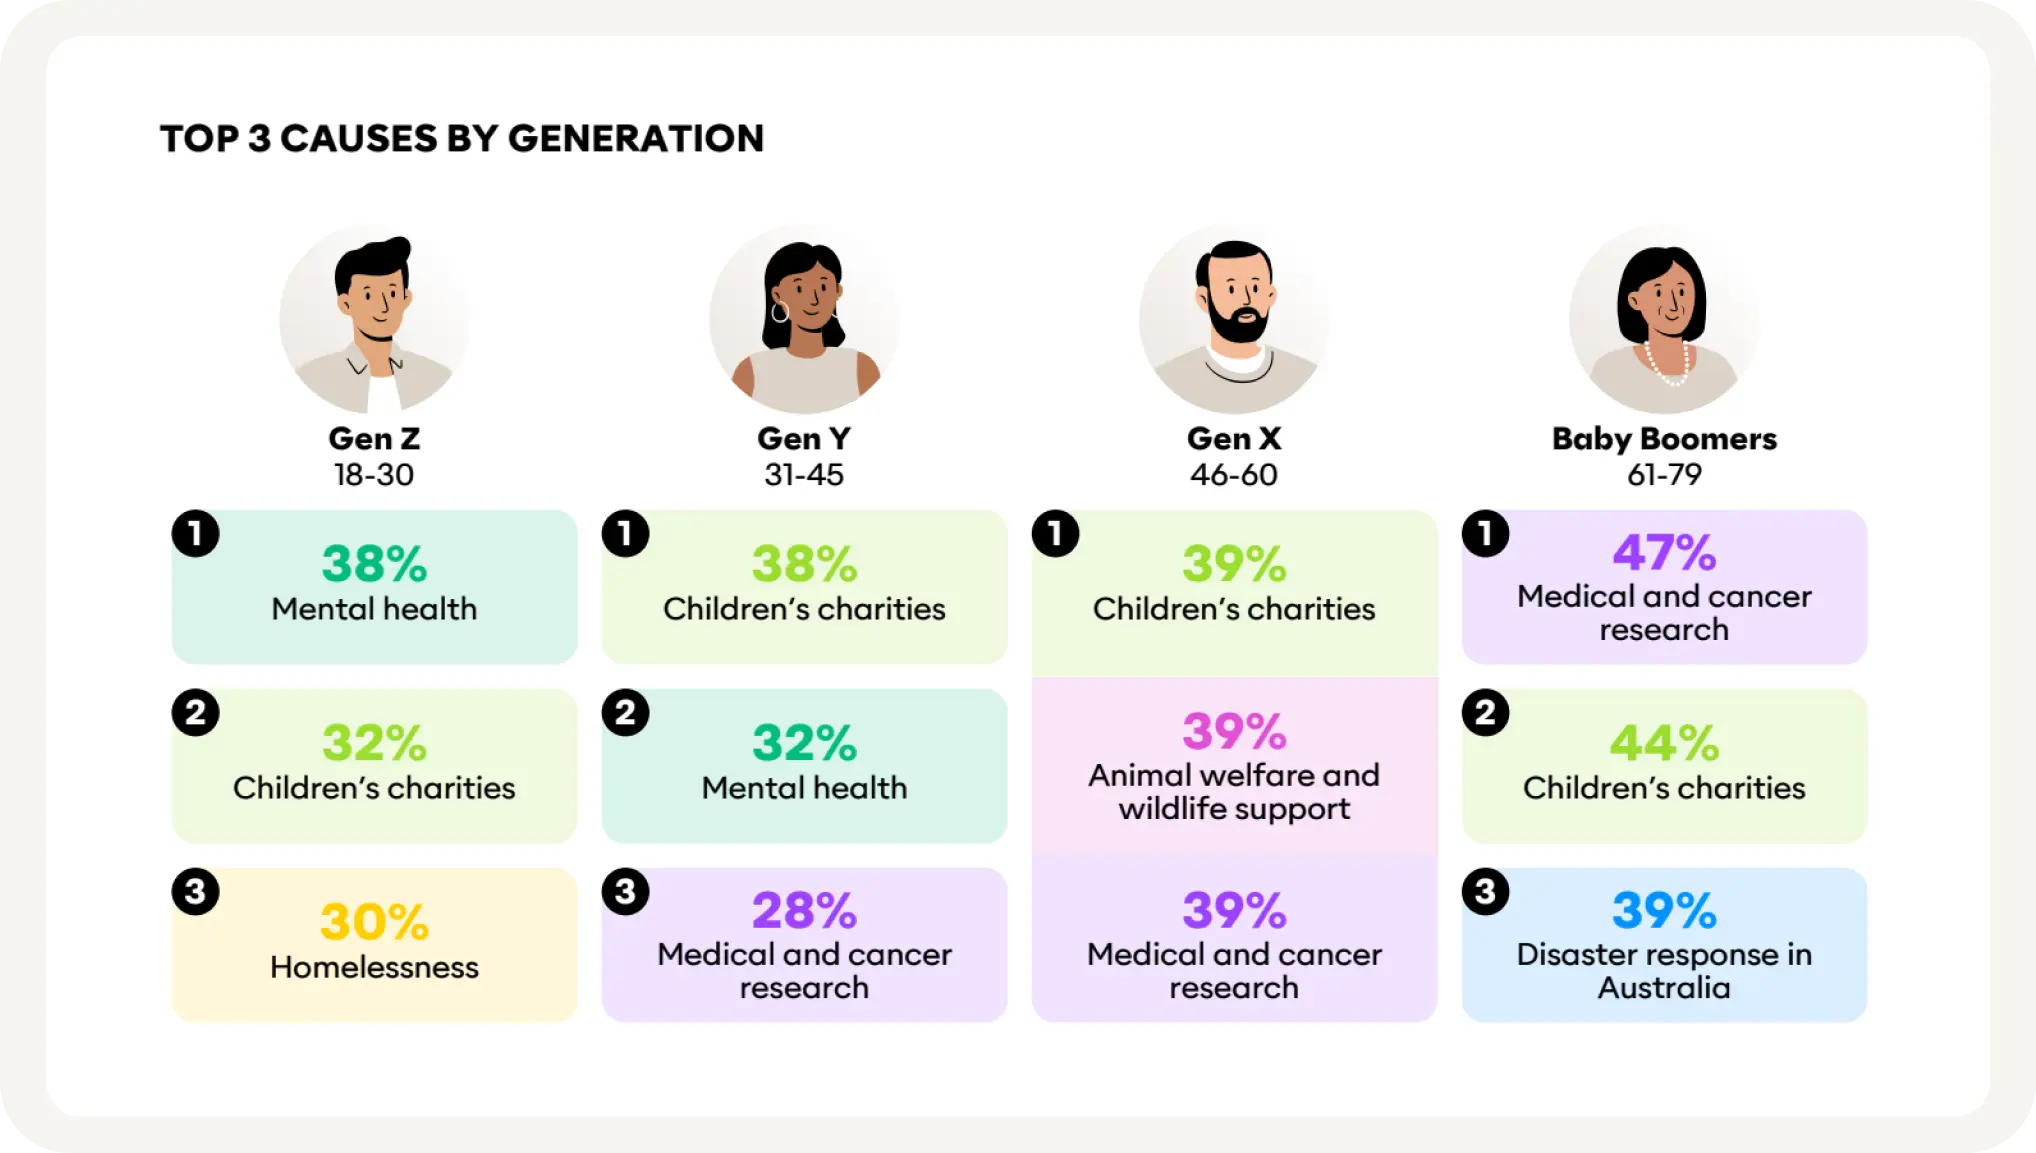
This is consistent with the influences on people’s decision to give to charities, with 59% saying they give to a cause because of a personal connection. This also reflects the various needs of those in the different generations with Gen Z and mental health, Gen Y and Gen X most likely to be in parenting years and Boomers likely to see medical conditions in their peer groups as they age.
Interestingly Gen Z are giving consistently, just to a greater number of charities. 27% of Gen Z gave financially to 5+ charities in the last 12 months, compared to 15% of Gen Y, 10% of Gen X and 11% of Baby Boomers. The willingness to support multiple organisations could also indicate a more fluid approach to brand loyalty in the charitable sector, with Gen Z potentially following causes and impact rather than specific organisations. Given that they are digital natives, they might be more comfortable with micro-donations across multiple platforms. They also have greater exposure to global issues through social media which might give them more choice as to what they donate to.
Get all the insights on the NFP sector in the infographic:
- Shifting giving habits
- Charities people are most motivated to support
- Top causes by generation
- Engaging the future donor
- And much more