Fast facts on marriages in Australia

Whilst the marriage rate has been slowly declining over the decades, as our population grows, there are still more weddings now than there were a decade ago. We hit the peak number of weddings in 2012 with over 123,000 weddings that year.
The average female is getting married at 28.3 today and males at 29.9, this has been pushed back by about 5 years over the last 3 decades.
 The total number of divorces has been declining – there are fewer now than any time in the last 20 years, as both the divorce rate and divorce numbers have been declining. 10 years ago the divorce rate was 2.7 per 1,000 people, one year ago it was 2.2. and it is now 2.1 per 1,000 people.
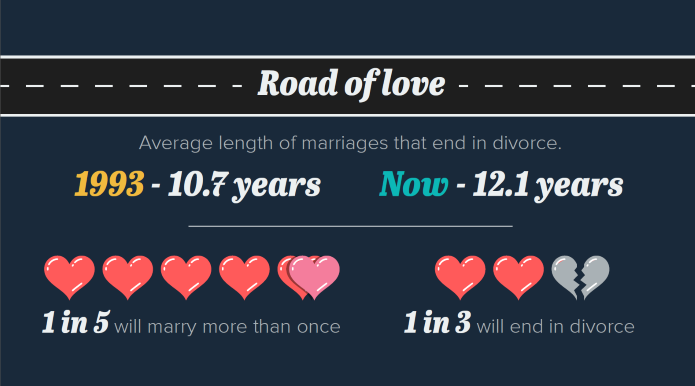
Whilst 1 in 3 marriages end in divorce, they are lasting longer than 2 decades ago. In 1993, the average length of marriages that ended in divorce was 10.7 years, today they are lasting 12.1 years on average. 77% of Australian couples cohabitate before getting married.
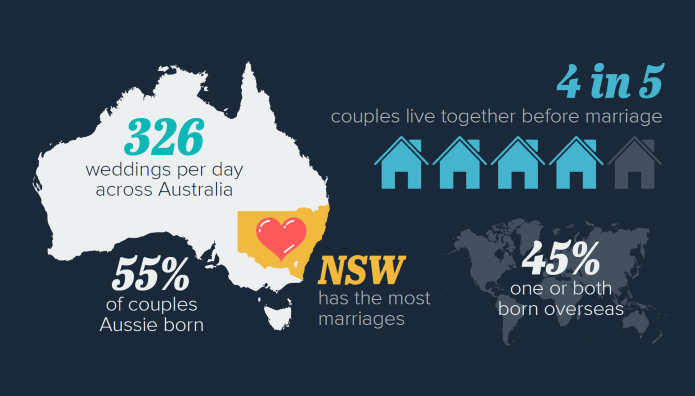 There are on average 326 weddings across Australia per day. This swings between over 2,000 weddings on a popular Saturday to just 37 weddings on Christmas Day!
The most popular times to get married during the year are Spring and Autumn, in the months of November and March. The least popular months are June and July each of which only hosts 5% of yearly marriages. Popular wedding dates are on the increase, with 923 marriages held on Australia Day.
Download the full infographic here.
Find Out More
For more on understanding data and communicating it effectively head to Analyse Australia, where you can download our full report here.