Kickstart your year with data

Every day we generate millions of points of data. It’s an integral part of our lives, powering our purchasing decisions, what we fill up our time with and even what to eat.
Technology has approached an age where data analytics are not just for big corporations. Every business, small or large can and will be collecting data from their customers (from Facebook to the local gym).
This data is collected to maintain organised records and inform strategic business decisions.
Peter Sondergaard of Gartner Research says, “Information is the oil of the 21st century, and analytics is the combustion engine.”
How to gain insights from internal and external data
Governments collect demographic data to inform big picture decisions, create publicly available sources invaluable to businesses; provide a rich tapestry of knowledge from location to the surrounding community; and forecast trends that may occur.
“Running a business in 2020 is equal parts experience, intuition and knowledge. Knowledge about the customers you serve and information about their habits.” – Mark McCrindle
How can a business with all these resources turn both internal and external data into something of value?
Education is one sector we work with regularly – using their existing data to better understand their surroundings. We’ve replicated a small part of what we do with schools to inspire you in thinking creatively about your data.
In this example we used both internal and external data to create a demographic analysis of their surrounding catchment:
The Who
Our client is a school, looking for insights about their students and community.

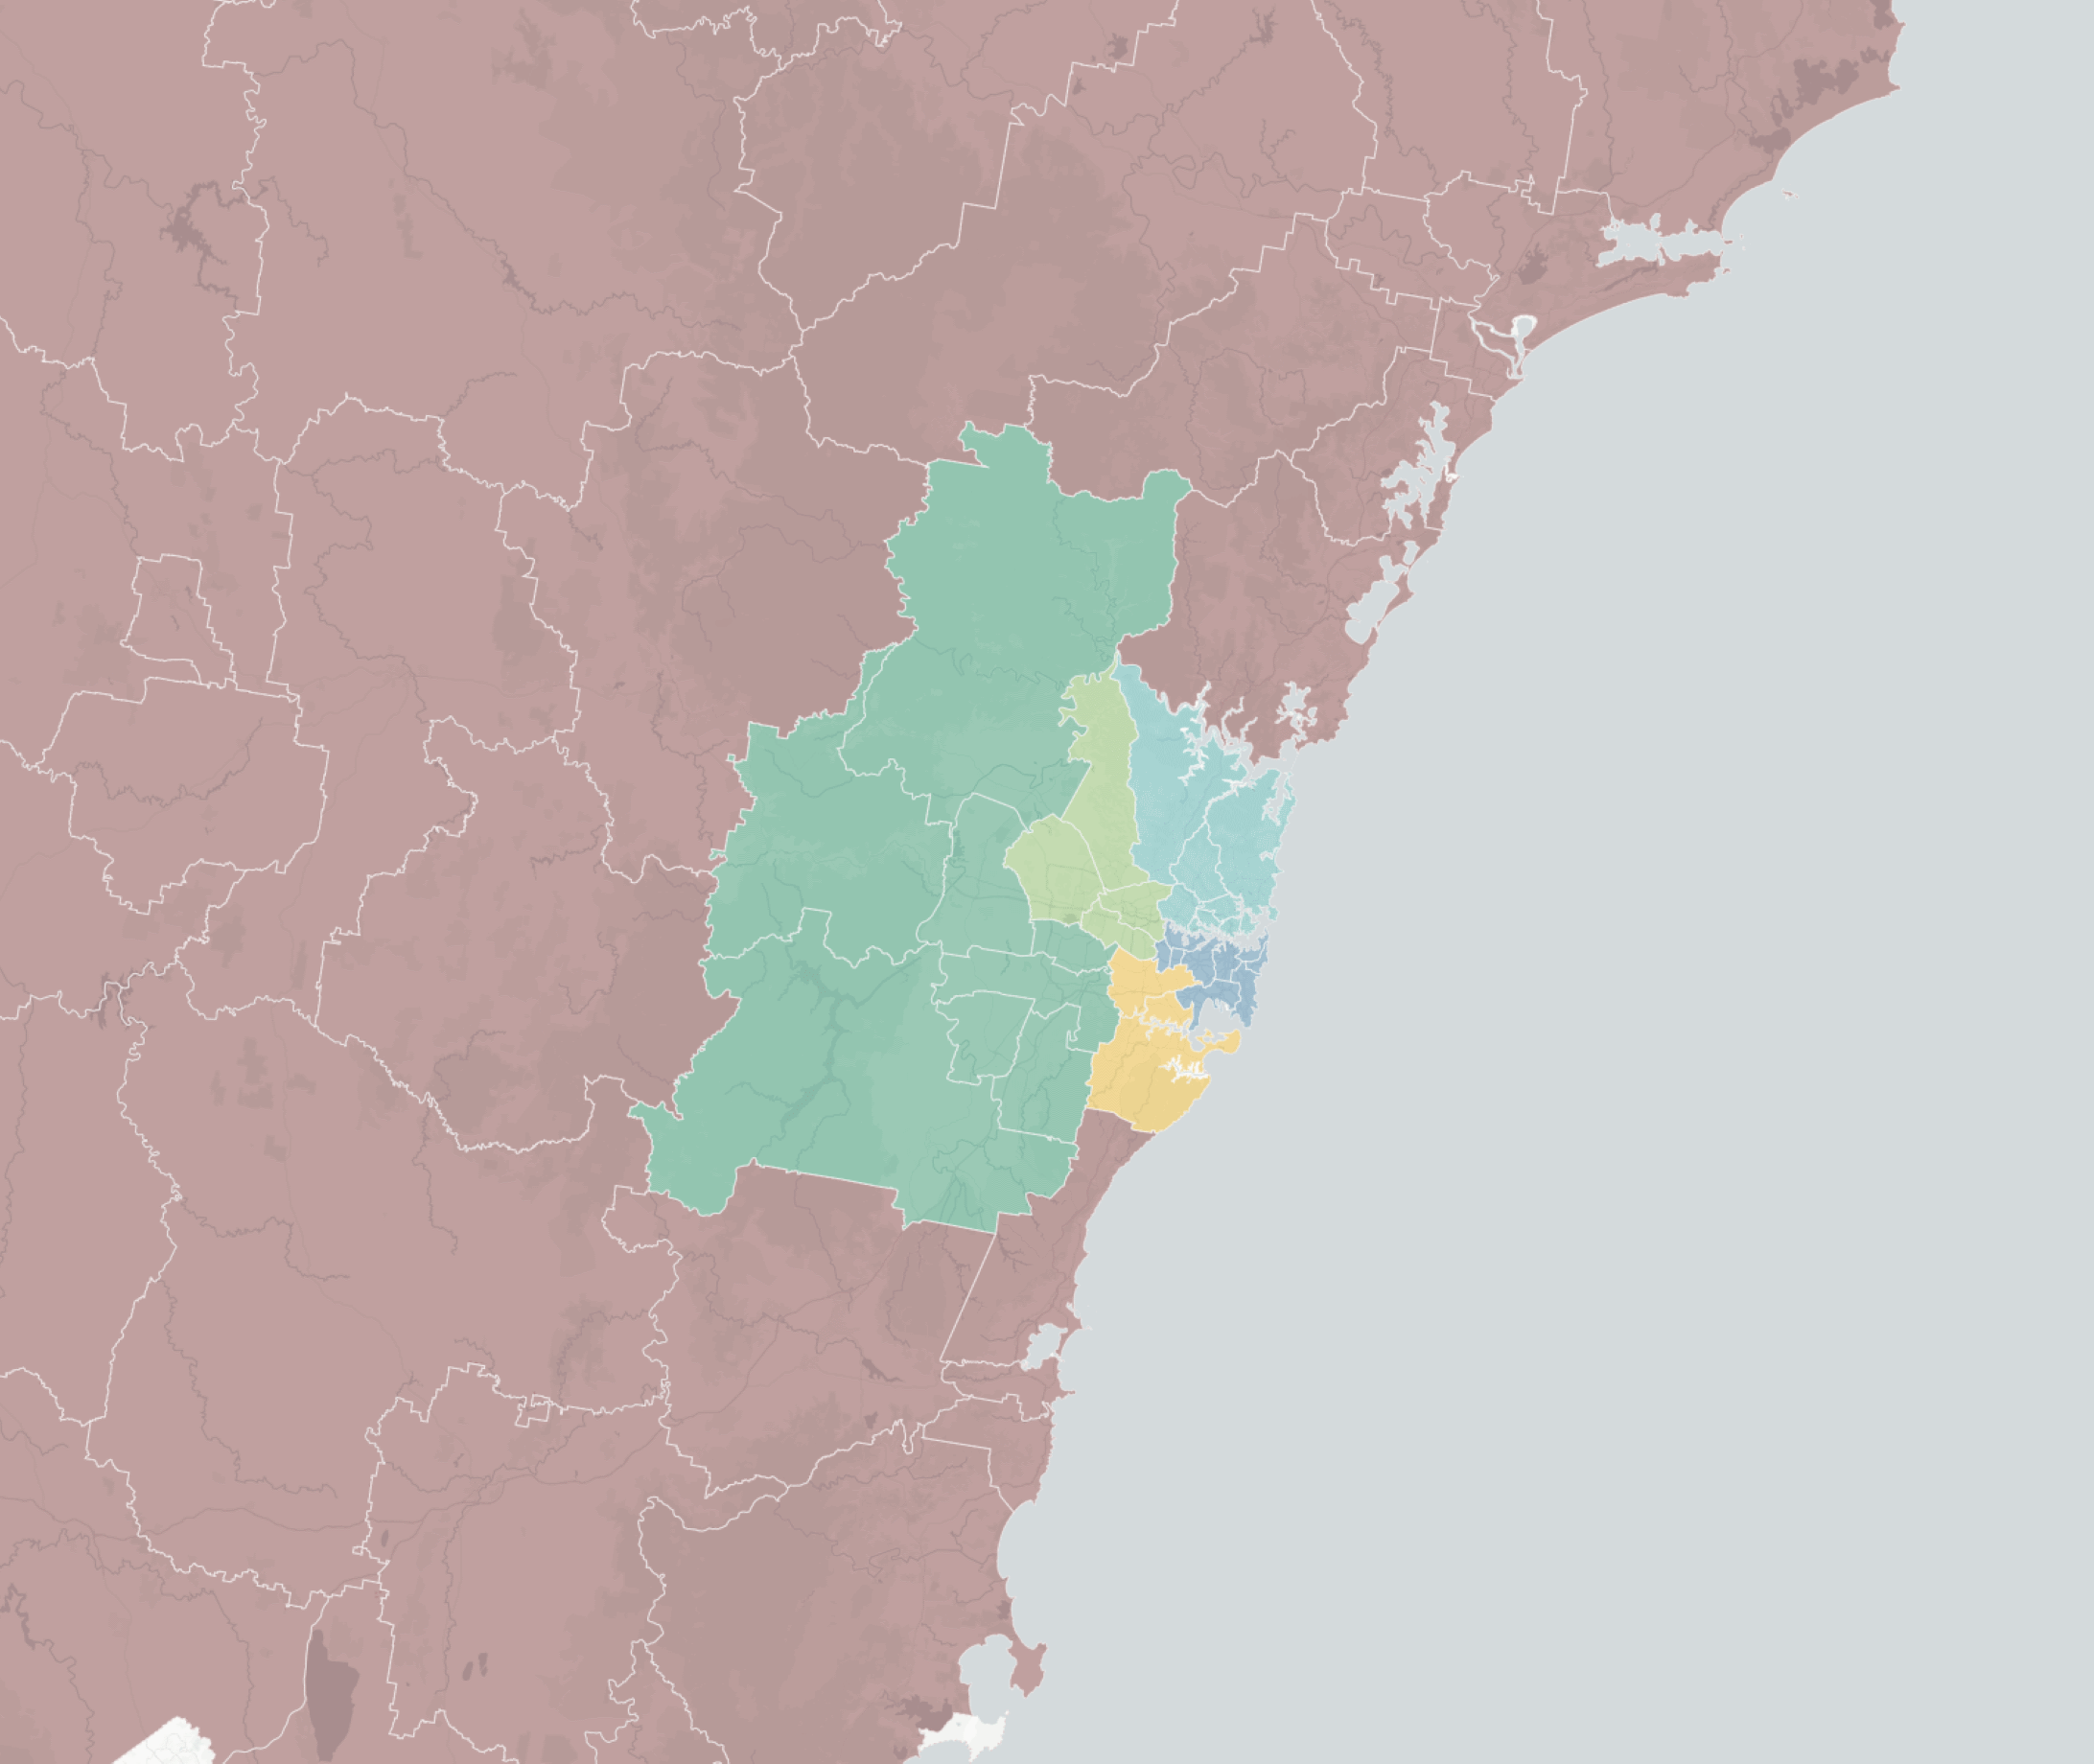
The Where
In consultation with the school, we defined a catchment area based on their internal enrolment data. The catchment is the area the school influences. Locality is a big factor in a parent’s decision-making process to choose which school their child will go to.
Each school has different factors that expand their range of influence, which can make it difficult for school’s to determine where their catchment starts and ends. We take the guesswork out of that.
The How
With the catchment defined, our next step was to determine the relevant insights about the community their students live in.
Using data sets from the Australian Bureau of Statistics we chose the following data points most insightful to the school:
- Population (current and future)
- Age breakdown
- Household composition
- Cultural diversity
Using these four data points, we can paint a picture of the school’s growth compared to their catchment’s growth; whether the catchment is ageing rapidly; the family composition of their students; and what nationalities their current students and potential future students are.
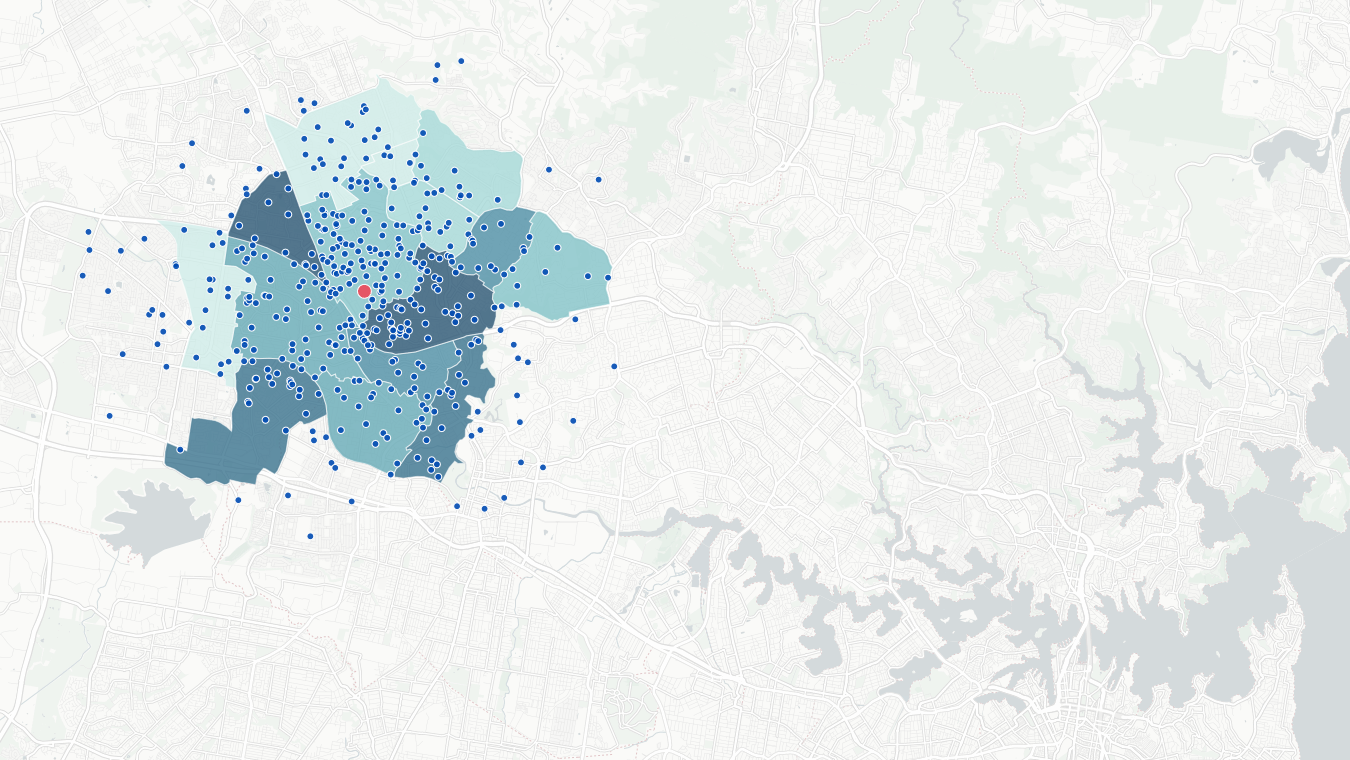
The What
The nest step is to consider what insights we can derive from both the internal (school) and external (demographic) data sources.
We began by colour coding the different areas on a gradient to show the most populated to the least, showing that a large proportion of the catchment’s population are to the west while areas to the north are less populated.
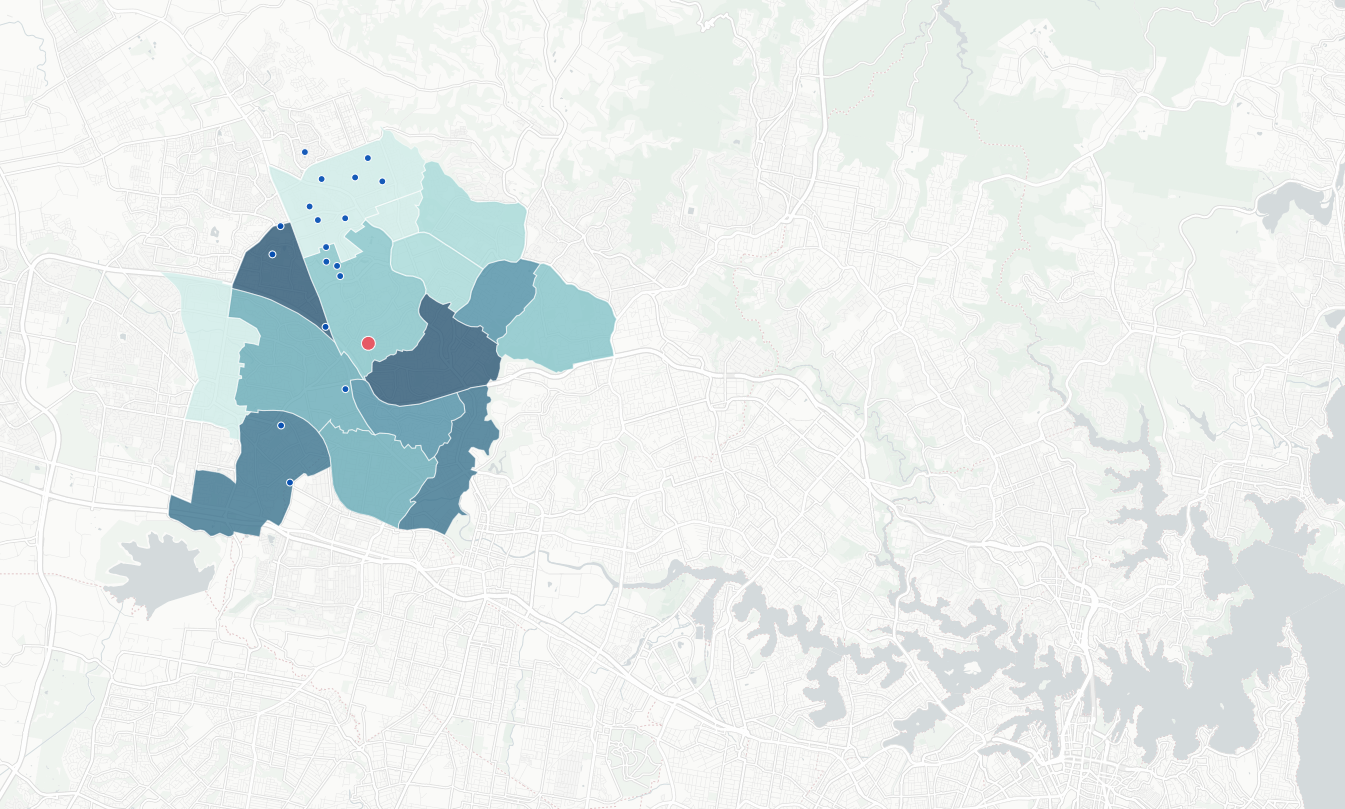
Secondly, we can see a large number of Arabic speaking students come from the school’s north west.
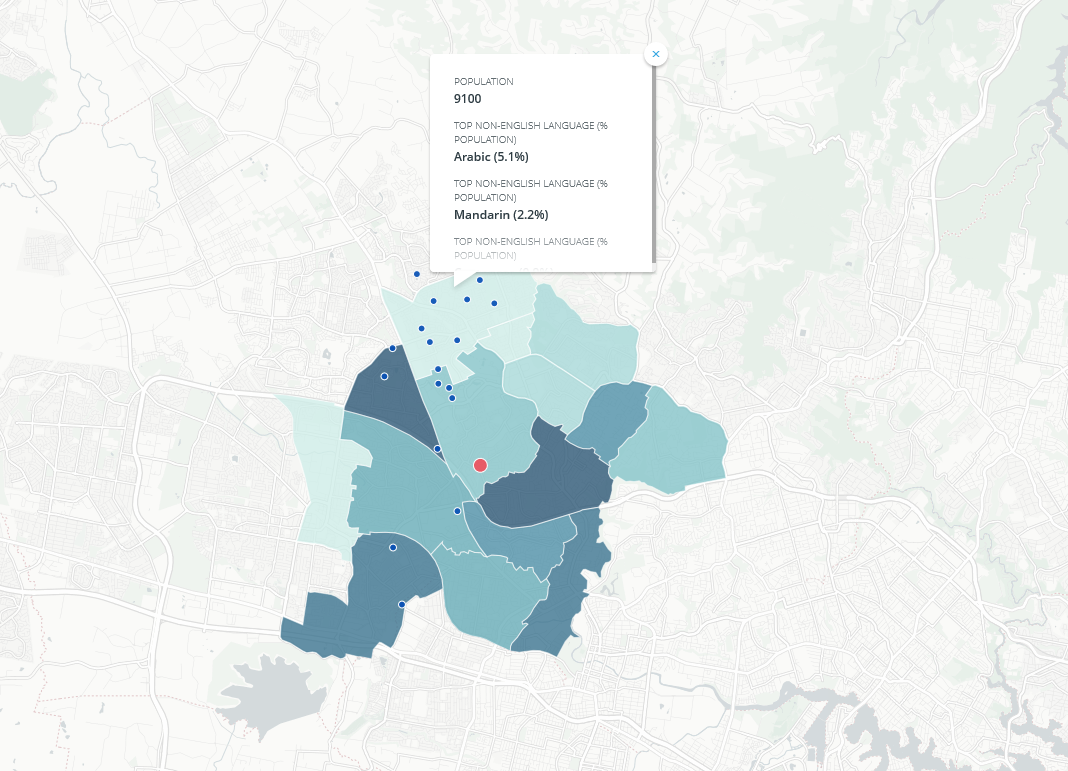
A further look at the demographic composition of the school’s catchment reveals that Arabic is one of the most common non-English languages spoken in homes within the area. Applying this insight might involve the school considering their communication with parents, with the knowledge that Arabic is spoken in many of the students’ homes.
The Why
As a result of this project, the school was able to think about the needs of their students and their parents based on insightful data. With this customer-centric understanding of the people they serve, the school can now think about tailored initiatives that offer value to specific groups of students and parents.
“Equipped with the full picture, decisions become informed and strategic instead of experiential and anecdotal.” – Mark McCrindle
The map we’ve created below visualises catchments and community data which can be used as a tool to inform strategic decisions.
*internal data points are fictionalised to protect client privacy.
For media commentary contact us on 02 8824 3422 or at [email protected]