Getting to Work

Over 10 million Australians make their way to work every day, with almost 2 in 3 doing so by private car. McCrindle Research analyses the data to determine how Australian workers commute, comparing movement by workers across the nation’s capitals.
The national traffic jam
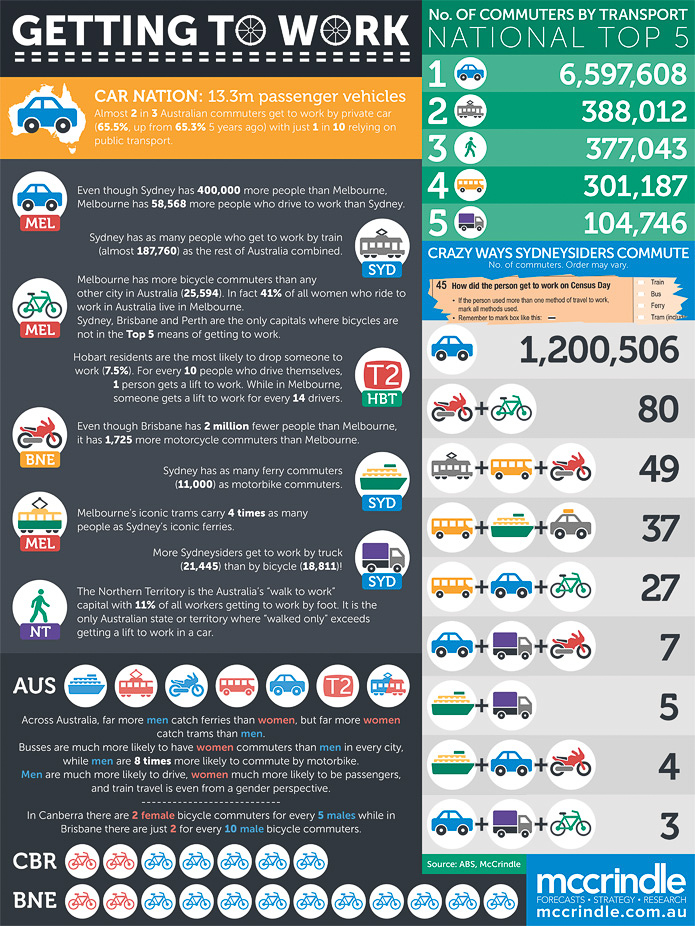
There are 18.3 million Australians aged 17 and over, and 13.3 million registered passenger vehicles in Australia – 1 vehicle per 1.37 people of driving age. Less than 1 in 10 households get by without a car while most (54%) have at least two cars.
If Australia’s 13.3 million passenger vehicles were parked end to end (based on the average 4.12 metre length of an Australian car), the traffic jam would stretch 54,796 kilometres, which is more than 13 times the distance from Sydney to Perth (4,000 km).
Car nation
The percentage of workers who commute by private care has risen to 65.5%, up from 65.3% 5 years ago, and just 1 in 10 Australians rely on public transport.
Of all adult Australians in full time work or study, more than 7 in 10 (71%) primarily use a passenger vehicle. Almost 9 in 10 adults use a car to get places other than work (88%).
To Pluto and back…20 times!
The average Australian car drives 12,881 kilometres per year which means Australians, in their more than 13 million vehicles drive a combined 167 billion kilometres annually. With Pluto at the outer edge of our solar system located 4 billion kilometres from earth, this is the equivalent to driving there and back almost 20 times every year!
Less green than half a decade ago
Australians are “less green” in their work commute than 5 years ago with 655,939 more people driving to work (up by 0.8%) and the only three commuting methods to have declined in share are walking (down 0.3%), going as a car passenger (down by 0.6%) and motorcycle/scooter (down by 0.1%).
Public transport plus
1 in 5 train commuters also require a car for their trip (as driver or passenger) but just 1 in 10 bus commuters also require a car. In total about 1 in 5 public transport users require multiple forms of transport for their commute.
More than half of Australians (54%) state that the reason that they don’t use public transport is that there is no service or none at the right time for them. Just 1 in 10 say it is because they need their own vehicle for work and just 1 in 12 need it to carry work items or other people.
An ageing population and ageing workforce means more car trips
As women age, their use of passenger vehicles to get to work increased and their use of public transport decreased. This trend was the same for men until age 55, from which point they use public transport more and commute by car less.
Sydney trumps public transport use
Even though Sydney has 400,000 more people than Melbourne, Melbourne has 58,568 more people who drive to work than Sydney.
Sydney is the Australian capital with the lowest proportion of commuters driving to work (53.7%) and the highest proportion of commuters using public transport.
Sydney has 1 million more commuters now than in 2006 but 6,653 fewer car passenger commuters today. However, there are more cars used to transport Sydneysiders to work than there are cars used by workers in the states of Western Australia, South Australia, Northern Territory and Tasmania combined (more than 1.2 million).
Sydney has as many people who get to work by train (almost 190,000) as the rest of Australia’s other national cities combined. Sydney is also the city of ferries – with just as many ferry commuters (11,000) as motorbike commuters.
More Sydneysiders get to work by truck (21,445) than by bicycle (18,811)!
Female cyclists lead the way in Melbourne
Melbourne has more bicycle commuters than any other city in Australia (25,594). In fact 41% of all women who ride to work in Australia live in Melbourne.
Sydney, Brisbane and Perth are the only capitals where bicycles are not in the Top 5 means of getting to work.
Tasmanians best at giving their mates a lift, but also drive the most cars
Hobart residents are the most likely to drop someone to work. For every 10 people who drive themselves, 1 person gets a lift to work. On the contrast, in Melbourne, someone gets a lift to work for every 14 drivers.
Tasmanians most rely on their car to get to work, with 87% involving a car in their commute, either as a driver or passenger. This is followed by Queenslanders (85%) and Canberrians (83%).
Brisbane the city of motorcycles
Even though Brisbane has 2 million fewer people than Melbourne, it has 1,725 more motorcycle commuters than Melbourne.
Ferrying, motorbiking, cycling, and driving more common among men while women are more frequent on trams, buses, and as car passengers.
Across Australia, far more men catch ferries than women, but far more women catch trams than men.
Busses are much more likely to have women commuters than men in every city, while men are 8 times more likely to commute by motorbike.
Men are much more likely to drive, women much more likely to be passengers, and train travel is even from a gender perspective.
In Canberra there are 2 female bicycle commuters for every 5 males while in Brisbane there are just 2 for every 10 male bicycle commuters.
NT the state for walking, SA the state for driving
The Northern Territory is the Australia’s “walk to work” capital with 11% of all workers getting to work by foot. It is the only Australian state or territory where “walked only” exceeds getting a lift to work in a car, and such are the numbers that a larger proportion of Territorians walk to work than the proportion of public transport users in all other states and territories (less than 10%).
In Adelaide work commuters have increased by 8% since 2006 but fewer people walk to work today (2.5%) than in 2006 (2.7%). It is also Australia’s drive to work capital with almost 7 in 10 workers arriving by car.
Strange ways to get to work
On the 2011 Census question, “How did you get to work on Census Day?” 1,200,506 workers in Sydney made their way to work in a car, 187,760 Sydney-siders took the train, and 107,895 the bus.
Other Sydney-siders, however, chose more unconventional ways to travel. 80 Sydneysiders reported taking both a motorcycle and a bicycle to work, and 49 Sydney-siders stated they took first a train, then a bus, and then a motorbike to work. An astounding 27 workers took a bus, followed by a car, followed by a bicycle ride.
Download the analysis and the infographic.