Thriving
Schools
Index
Get started
Key benefits:
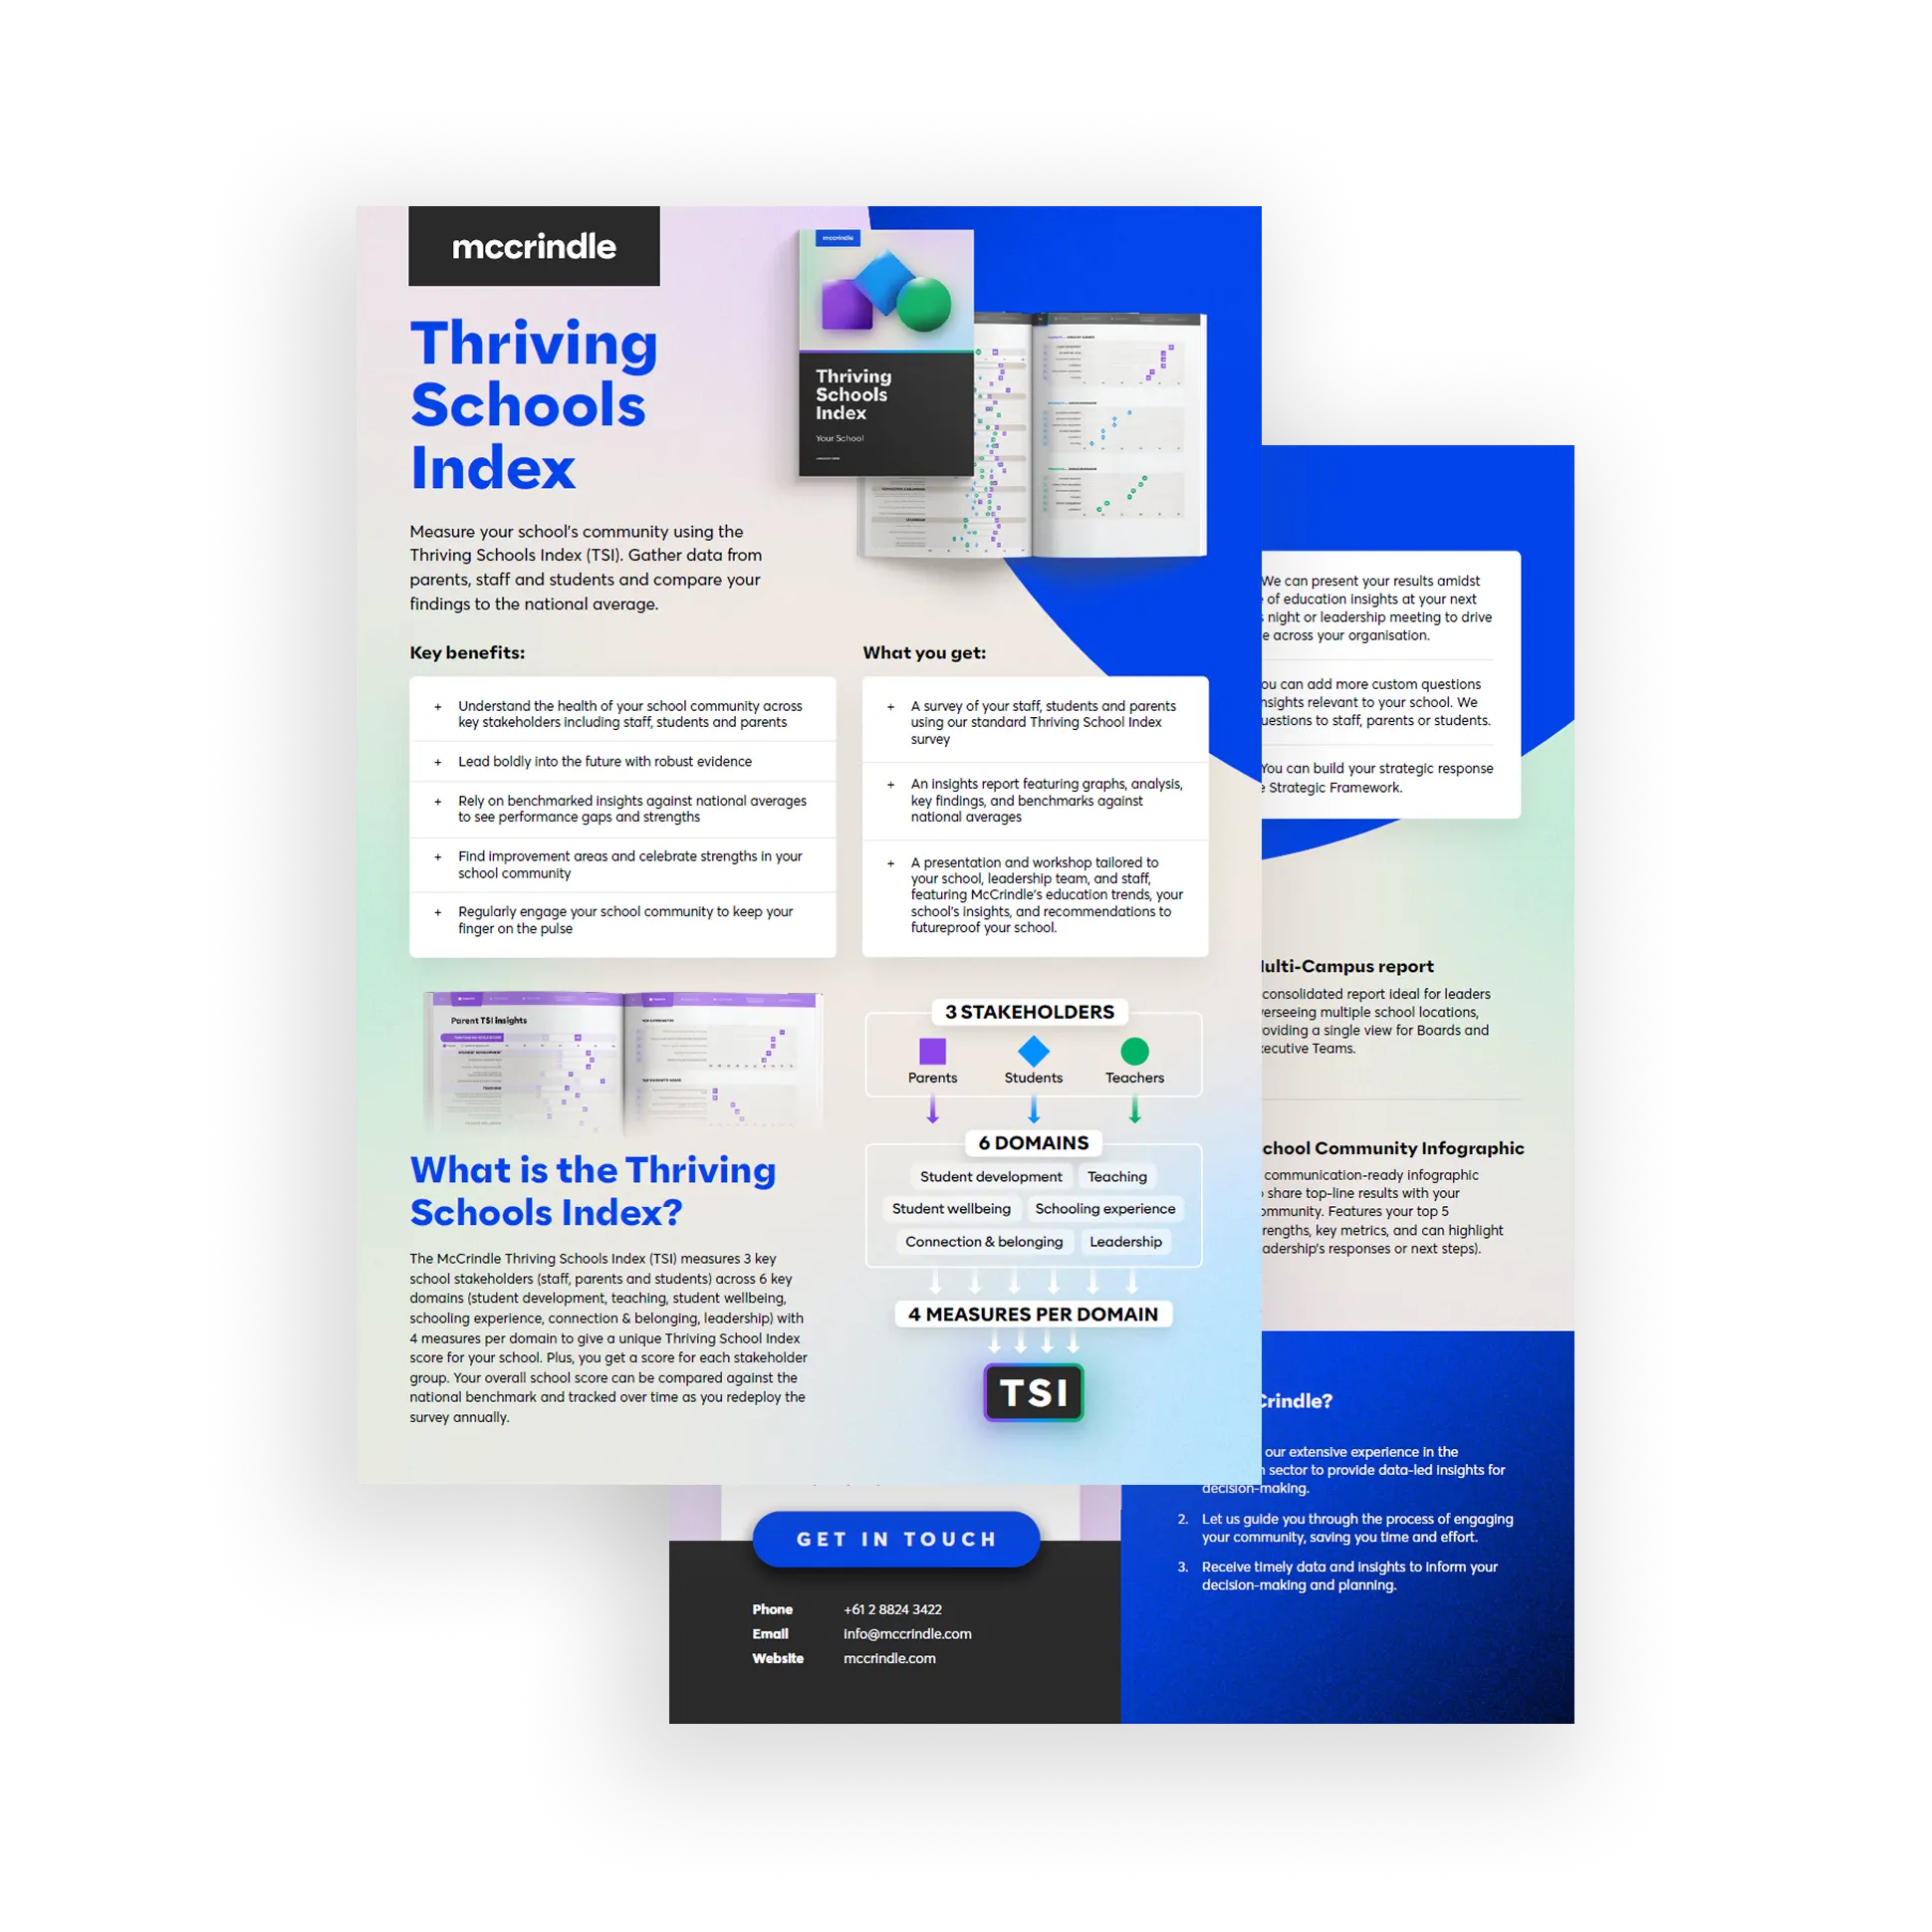
- Understand the health of your school community across key stakeholders including staff, students, and parents
- Lead boldly into the future with robust evidence
- Rely on benchmarked insights against national averages to see performance gaps and strengths
- Find improvement areas and celebrate strengths in your school community
- Engage your school community regularly to help keep your finger on the community pulse
What you get:
- A 10-minute mobile-friendly survey of your staff, students, and parents
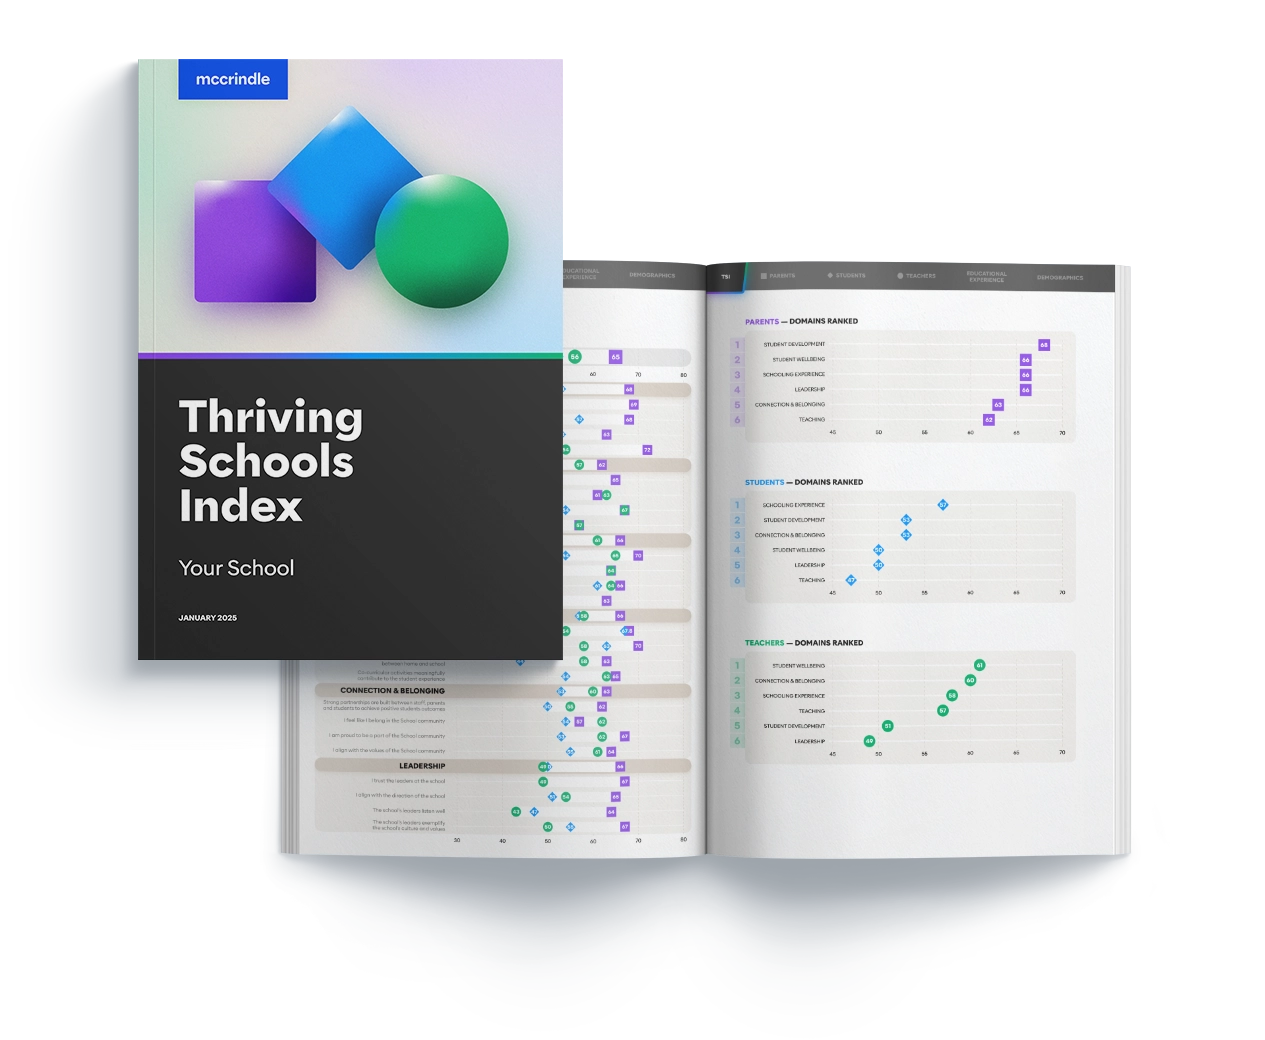
- An insights report featuring graphs, analysis, key insights, and comparisons with national benchmarks
- A presentation helping you digest the key findings and our recommendations for what to focus on next
The six pillars of a thriving school community
To help educational leaders create thriving learning communities, McCrindle has developed a six-part Thriving Schools Index to help schools identify their strengths and highlight areas for improvement. The effectiveness of a school’s learning community is measured across the following six areas:

Student
development

Teaching

Student
wellbeing

Schooling
experience

Connection and
belonging

Leadership
Empowering your entire team
The Thriving Schools Index is designed to solve the unique challenges faced by
today’s school leaders and community relations teams.
Strategic clarity & confidence
Board-ready insights, not just data
The TSI delivers simple, key metrics in a highly visual report, making it easy to digest the headlines and communicate exactly where to invest for the greatest impact.
Measure what actually matters
Satisfaction is a lagging indicator, once families or staff are dissatisfied, they may already be looking elsewhere. We measure lead indicators like Connection and Belonging so you can uncover community health before retention issues occur.
High engagement & alignment
A survey that respects your parents
Every survey is a brand interaction. We’ve replaced tedious 30-minute legacy surveys with a modern, mobile-friendly 10-minute experience. It respects the modern parent’s schedule, bridges the gap from “consumer” to community partner, and drives higher response rates.
Look beyond the vocal minority
It’s easy for loud voices to skew leadership priorities. By benchmarking perspectives across parents, staff, and students side-by-side, you can easily identify where expectations and reality differ, and align your community around a shared vision.
Establishing trust & understanding
Master your first 100 days
Your early actions set the tone for your leadership. The TSI provides a holistic “read” on your school’s culture through evidence-based listening, ensuring you understand the true priorities of your community without over-relying on anecdotes from the loudest voices.
Set a baseline & build trust
Your community is watching to see how you consult and engage. Deploying the TSI is a highly visible, efficient process that gathers perspectives across staff, parents, and students. It establishes a clear health baseline and demonstrates from day one that you are committed to building a thriving school community.
"How do we compare to other schools?"
The TSI allows you to measure your school's community and compare the results against the national benchmark.
Get started
Add-ons
Enhance your TSI with add-ons




Overview of the Thriving Schools Index
Built on years of research
The TSI has been built on the foundation of decades of research, drawing on what is proven to be an effective way of measuring a school community.


What people say
"Upon reviewing the Thriving Schools Index and the clear reporting McCrindle offers, I knew this would help us engage our staff, parents and students in a meaningful and robust manner. From our very first conversations I felt McCrindle truly grasped what we needed."
Deb Magill, Headmistress
St Catherine’s, NSW
"When the survey wrapped up, they didn’t just deliver results, they took the time to walk our Executive team through the findings, offering insights that were both practical and immediately useful. I wouldn’t hesitate to recommend McCrindle to any School seeking meaningful data and a team that’s a pleasure to partner with."
"The Thriving Schools Index gave us a clear, evidence-based picture of our community. It allowed us to celebrate our strengths while providing the data that gave insight into our opportunity areas."
"Partnering with McCrindle transformed our strategic planning process. The McCrindle team’s facilitation ensured the data became a catalyst for rich conversations rather than simply a collection of statistics. Their combination of research expertise, practical facilitation and authentic care for people is exceptional, and the experience has left a lasting impact on our College."
"The TSI provided a level of granularity and analysis that had previously been unavailable to us. The presentation of the summary and full report was outstanding, as was the level of support provided throughout the process. We now have a real benchmark on which we can assess how well strategic initiatives assist in achieving our vision. First-class!"
Your next school stakeholder study
The TSI allows you to measure your school's community and compare the results against the national benchmark.
Download flyerFrequently asked questions
Trusted by the education sector












Why McCrindle?
- Lean into our experience in the education industry to ensure dependable information for decision-making.
- We handle the setup, distribution and collection of survey data to save you time and take the weight off of managing it.
- You’ll get data and insights promptly so you can use it for decision-making and planning.

Get the Thriving Schools Index for your school
Fill out the form, and one of our team will be in touch shortly.